Everyone has their own way of evaluating players in fantasy baseball. We all have certain stats we pay the most attention to when deciding who to pick up, whether to accept a trade, etc. In this article, I am going to examine how certain statistics relate to fantasy value. I know no singular statistic can tell you how much a player is worth in fantasy, but I want to see how certain statistics, some basic, some advanced, directly correlated to fantasy value in a standard 12-team 5×5 league in the 2019 season.
First, I need to calculate the player values from the 2019 season. If you are interested in the process I use to calculate players’ fantasy values, see my pre-season article. For the players who had multi-position eligibility, I only included them at the position they were most valuable at this season. For example, Kris Bryant was much more valuable as an outfielder than as a third baseman in 2019. I also included the DH-only eligible players at OF for simplicity.
Here were the 135 most valuable batters for a 12-team standard 5×5 league in 2019.


The first thing you might notice is that Yelich, Bellinger, and Acuna were the three most valuable hitters by a good margin. Also, as expected, J.T. Realmuto was by far the most valuable catcher this season in a standard league.
When I look to add a free agent batter in fantasy baseball, I generally look for a good on-base percentage and how many homers they hit over the past few weeks, among other things. I wanted to see exactly how these and other stats correlate to fantasy value.
First, I plotted each of the five standard categories against player value to see how much each of them correlate.


It’s easy to see that runs, home runs, and runs batted in would have a close to strong correlation with fantasy value in standard 5×5 leagues, while batting average has a weaker correlation, and steals have a weak correlation. It goes without saying that players who steal lots of bases while also helping you in some or all of the other four categories are very valuable.
Now I want to see how the other two categories in the triple-slash line correlated to value this season: on-base and slugging percentages.


While not the strongest of correlations, they are both much stronger than batting average in leagues that count batting average. Now let’s take a look at how more advanced statistics directly correlate: wRC+, wOBA, fWAR, and WPA.


fWAR has a strong correlation, significantly higher than all the statistics thus far except runs. Now let’s see how some plate discipline statistics correlate: walk, strikeout, swinging strike, and hard contact percentages.


Surprisingly, all of these correlations are weak. In leagues that count on-base percentage instead of batting average (all leagues should do this), I would expect walk rate to have a strong correlation to fantasy value.
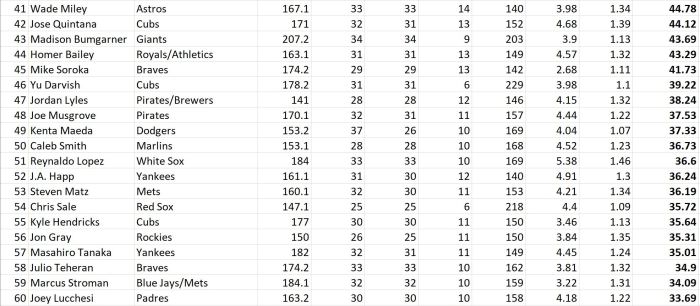
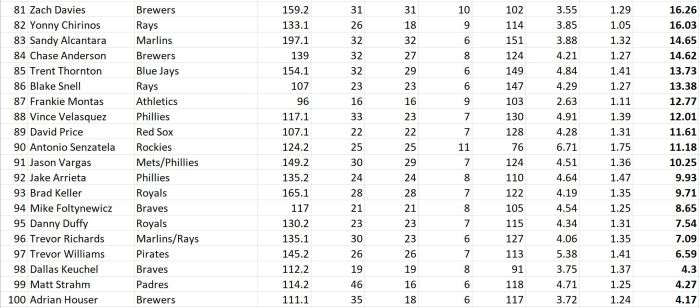
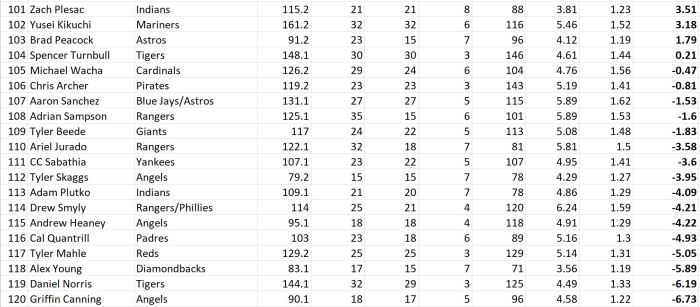
Now for the starting pitchers. I included those who started at least 15 games this season, not including openers. Here are the 135 most valuable starting pitchers for a 12-team standard 5×5 league in 2019.
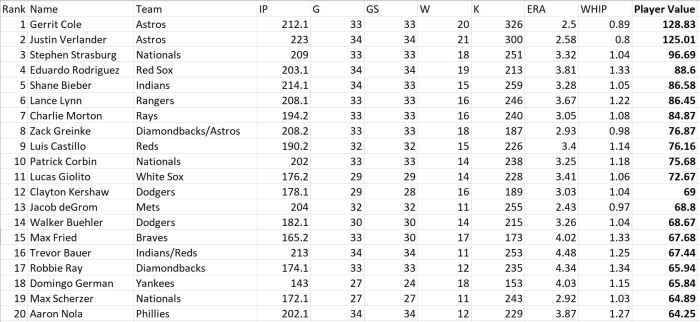


Gerrit Cole and Justin Verlander were in a tier of their own this season, as shown by their values. If Mike Clevinger would have played a full season, he likely would have been up there with them. Eduardo Rodriguez at fourth might surprise some people, but he had over 200 strikeouts and a whopping 19 wins this season without hurting you much in the other two categories.
When I look to make pickups at the starting pitcher position, I usually look for guys who have a good swinging strike percentage in their latest starts and who have a good SIERA.
First, let’s start with the 4 categories that directly influence their value.


We already knew that wins and strikeouts have a very strong effect on the fantasy value of a pitcher, but with both having a correlation coefficient of 0.9 or higher, this proves that even the pitchers who have bad ERAs but still strikeout a ton of batters are very valuable.
Now I will see how the predictive stats of ERA correlate: FIP, xFIP, and SIERA.


I thought these would have a stronger correlation to fantasy value than ERA, but all four of them are right around the 0.6 mark. Now, let’s take a look at strikeout to walk ratio and average fastball velocity, while also looking at the advanced stats fWAR and WPA.


Just like for batters, fWAR has a strong correlation with fantasy value, even more so than the fWAR for batters. The strikeout per walk ratio correlation was weaker than I expected, and average fastball velocity has a weak correlation. Lastly, let’s see how swinging strike, ground ball, and hard contact percentages compare.


Swinging strike percentage has a moderate correlation with fantasy value, while the other two have weak correlations.
The only statistics I presented that have a strong direct correlation with fantasy value for batters is fWAR, with several that are close. For pitchers, Wins, Strikeouts, and fWAR have strong direct correlations, with a few that are close to being strong as well.

Leave a comment