When I first started playing fantasy baseball, I was in middle school, and in the years up to and through high school, I had lots of time to do research. I would make my own rankings, read about and form my own opinions on every player, etc. Then college came around, and between all the homework, clubs, and sports games, I didn’t have as much time to do my fantasy baseball research.
When it was draft day my freshman year (2017), I had done little to no research leading up to it, so naturally, when it became time to draft, I pulled out my phone and brought up some fantasy projections. This ended up working really well. I won that league, partially because I traded for Giancarlo Stanton in April, but that’s another story.
Sophomore year came around, and it was early February. I knew a lot of the players in the league from playing fantasy baseball for so long and from being a part of M-SABR for a semester, but I still did not have the time I wanted to do thorough research before my drafts. So I decided to try something new. I wanted to see how valuable each player is really worth at their position, using only the numbers.
So I created my own system for evaluating players in rotisserie and head-to-head categories leagues. I’m going to go through how I calculate my player values in a standard 12-team 5×5 league (R, HR, RBI, SB, AVG for batters, W, SV, K, ERA, WHIP for pitchers), with 3 outfielder slots, no middle- or center-infield slots, and 9 pitching slots, using Steamer projections from Fangraphs.
The Formula
In short, my formula calculates how much more valuable each player is than replacement level at their position (like WAR). Since this is a 5×5 league, 5 numbers, 1 for each category, need to be added up to get the total value for each player. Each of the 5 numbers had 2 parts, the first being how much more the player has at the statistic than replacement level, and the second is a constant. It is constant because, for example, 1 stolen base is worth more than 1 RBI.
This first part will only involve the hitters. To get the replacement level for a position, first, you need to multiply the number of teams in your league by the number of players you start at that position. For this league, this number will be 12 for the catcher and the infield positions and 36 for outfielders. Then, you just sort by that category and record the statistic that is in that particular position. For example, the 12th-best projected run total at the catcher position is 39. Here are the replacement level numbers for each of the offensive positions (among players that have at least 200 projected plate appearances).
| – | R | HR | RBI | SB | AVG |
| C | 38 | 11 | 39 | 2 | .249 |
| 1B | 74 | 25 | 80 | 5 | .270 |
| 2B | 70 | 16 | 63 | 11 | .273 |
| SS | 74 | 17 | 69 | 15 | .271 |
| 3B | 78 | 25 | 79 | 6 | .272 |
| OF | 74 | 23 | 75 | 11 | .267 |
I also included the players that only have DH eligibility in the position group that each of them used to play. For the players that have multi-position eligibility, you should draft the one that has more value.
Now we have to calculate the constants. Before I go more in depth about how I use them, I’ll talk about how I calculate them. To do this, I go through each position, as I did to get the replacement level numbers, and I record the highest projected total at each position. However, I use my best discretion to account for the fact that there are outliers. Most of the time, I use the second-best projected total, but sometimes I use the third-best if two players are projected for a lot more than the rest of the players for their position at that category. This also depends on how many players you start at each position: I use the fourth or fifth highest projected totals at each category for the outfield position because this league has three outfield slots.
Some examples of outliers in this year’s Steamer projections include the stolen bases category among shortstops (Trea Turner and Adalberto Mondesi are both projected for 41, 19 more than the third-highest projected total of 22) and the home runs category among catchers (Gary Sanchez is projected for 28, 5 more than the next highest projected total of 23). Here are the “trimmed mean” highest projected totals for each category at each position.
| + | R | HR | RBI | SB | AVG |
| C | 65 | 23 | 67 | 5 | .269 |
| 1B | 90 | 32 | 93 | 15 | .286 |
| 2B | 84 | 22 | 84 | 22 | .291 |
| SS | 87 | 30 | 94 | 22 | .287 |
| 3B | 97 | 32 | 94 | 11 | .287 |
| OF | 95 | 36 | 101 | 27 | .297 |
Next, we need to calculate the differences between the “trimmed mean” highest projected totals and the replacement level totals for each category at each position. Then, we need to take the average for each category, as seen at the bottom of this chart.
| Dif | R | HR | RBI | SB | AVG |
| C | 27 | 12 | 28 | 3 | .020 |
| 1B | 16 | 7 | 13 | 10 | .016 |
| 2B | 14 | 6 | 21 | 11 | .018 |
| SS | 13 | 13 | 25 | 7 | .016 |
| 3B | 19 | 7 | 15 | 5 | .015 |
| OF | 21 | 13 | 26 | 16 | .030 |
| AVG | 18.33 | 9.67 | 21.33 | 8.67 | .019 |
Now that we have the averages for each category, we use them to get the constants. First, we multiply .019 by 1000 to make things easier to read (the constant will be multiplied by 1000 as well). Next, we find the largest number, and that category will have a constant of 1 in the formulas, which will be the 21.33 in the RBI category. Finally, we divide the largest by the other four to get the rest. These are the constants that we get for this 12-team 5×5 standard league.
| R | HR | RBI | SB | AVG |
| 1.16 | 2.21 | 1 | 2.46 | 1.12 * 1000 |
Think about it. It makes sense that one home run is a little more than twice as valuable as one RBI, and one stolen base is about as valuable as one home run. If we were to use different constants for each individual position, it would not make sense. By that logic, if you look at catchers, one stolen base would be nine times more valuable than one RBI, or if you look at shortstop, one home run would as valuable as one run, which obviously isn’t true in fantasy baseball.
Here are the player value formulas for each of the six offensive positions:
C: Value = (R – 38)*1.16 + (HR – 11)*2.21 + (RBI – 39) + (SB – 2)*2.46 + (AVG – .249)*1120
1B: Value = (R – 74)*1.16 + (HR – 25)*2.21 + (RBI – 80) + (SB – 5)*2.46 + (AVG – .270)*1120
2B: Value = (R – 70)*1.16 + (HR – 16)*2.21 + (RBI – 63) + (SB – 11)*2.46 + (AVG – .273)*1120
SS: Value = (R – 74)*1.16 + (HR – 17)*2.21 + (RBI – 69) + (SB – 15)*2.46 + (AVG – .271)*1120
3B: Value = (R – 78)*1.16 + (HR – 25)*2.21 + (RBI – 79) + (SB – 6)*2.46 + (AVG – .272)*1120
OF: Value = (R – 74)*1.16 + (HR – 23)*2.21 + (RBI – 75) + (SB – 11)*2.46 + (AVG – .267)*1120
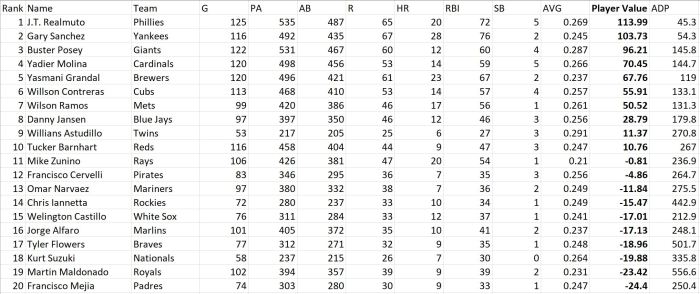
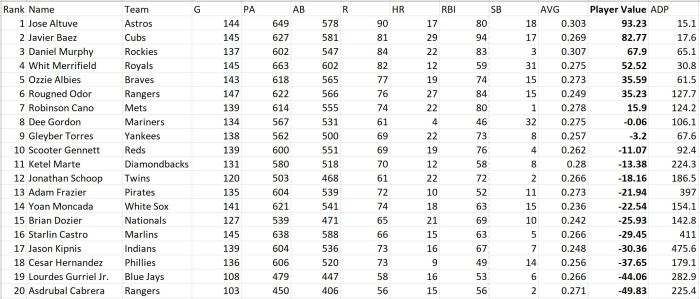
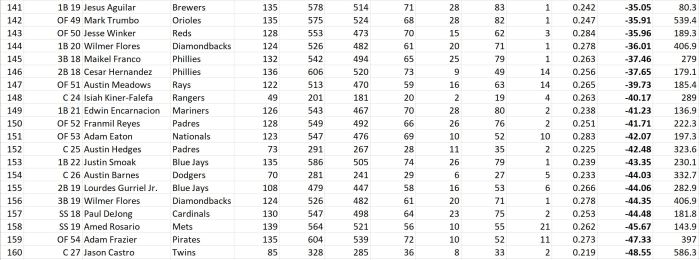
The Player Values (Hitters)
Catchers:
First Basemen:

Second Basemen:
Shortstops:

Third Basemen:

Outfielders:


Overall:


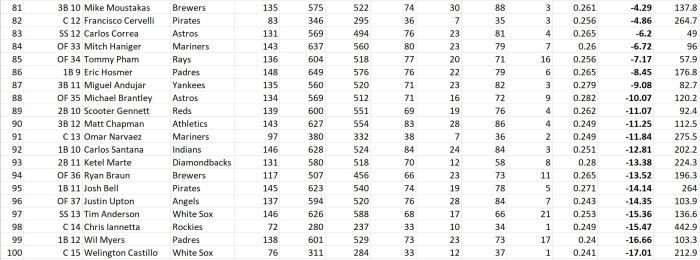


You may be thinking to yourself: how is J.T. Realmuto more valuable than Alex Bregman, or Aaron Judge? First of all, this is a shallow league, so every player in your lineup is more important, but if you look at the numbers, you will see it’s pretty clear. Take Bregman. The replacement level stats for third basemen are 78 runs, 25 homers, 79 RBIs, 6 steals, and a .272 average. Steamer has Bregman projected for 18 more runs, 1 more homer, 11 more RBIs, 4 more steals, and 7 more batting average points than a replacement level third basemen.
The replacement level stats for catchers are 38 runs, 11 homers, 39 RBIs, 2 steals, and a .249 average. Steamer has J.T. projected for 27 more runs, 9 more homers, 33 more RBIs, 3 more steals, and 20 more batting average points than a replacement level catcher. Other than Bregman’s 1 extra steal, J.T. is better than replacement level at his position in every category, contributing much better stats than a replacement level catcher in the runs, RBIs, and average categories in particular.
Am I saying you should draft J.T. at 3rd overall? No, because you can get him in the 4th round. The point is that having a top-tier catcher is very valuable in this type of league. If the league had more than 5 hitting categories or had more teams, the value of catchers would go down. I am saying that in a standard 12-team 5×5 league, you should prioritize drafting a top-tier catcher.
Not just that, but when you are about to make a pick, don’t just look at the raw stats, think to yourself: how much of an advantage am I getting at this player’s position by drafting him?
Some other sleepers jump out at second base, including Daniel Murphy, whose projected .307 average and 83 RBIs give him a huge advantage at the position, and Jose Altuve, whose ADP is in the second round but should be a mid-first round pick based on the massive advantage he gives at the position with his projected 90 runs, 80 RBIs and .303 average.
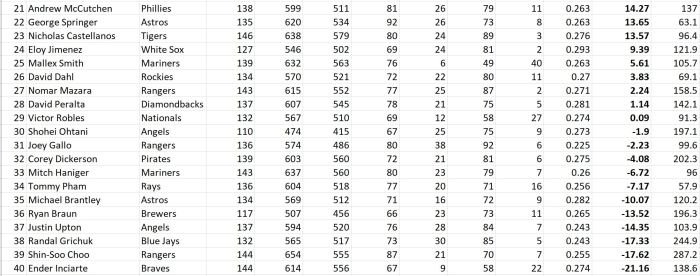
You also may have noticed that first baseman Cody Bellinger and outfielder Cody Bellinger are back to back in the rankings, meaning that he gives about the same value at both positions. Meanwhile, Javier Baez is more valuable at second base than shortstop because second base is a very weak position.
Pitchers
A similar process is done for the pitchers, but only for starters. After some trial and error, I realized that it is not smart to do this process for relief pitchers because, realistically, all that matters is the number of saves they get. Sure, you want closers that have a good ERA and WHIP, but the contribution they make to your overall ERA and WHIP is minuscule compared to the contribution your starters make to those categories. So I would suggest going off your favorite closer rankings during your draft.
Since this league has 9 pitching slots, I assume teams will devote 3 of those to their relievers, leaving 6 slots for your starters. Also, there are 5 bench spots in standard leagues, and I assume that 3 of those are devoted to starting pitchers. Therefore, to get replacement numbers for each of the categories (excluding saves), I use the number in the 12 * 9 = 108th best position. Here are those numbers.
| – | W | K | ERA | WHIP |
| SP | 8 | 116 | 4.30 | 1.35 |
Here are the “trimmed mean” highest projected totals for each category.
| + | W | K | ERA | WHIP |
| SP | 13 | 214 | 3.44 | 1.14 |
And here are the differences.
| Dif | W | K | ERA | WHIP |
| SP | 5 | 98 | 0.86 | 0.21 |
I use a similar process to get the constants. First, I multiply the ERA and WHIP differences by 100 to make things easier to read (the constant will be multiplied by 100 as well). Since 98 is the largest number, the strikeouts category will have a constant of 1. Here are the constants for this league.
| W | K | ERA | WHIP |
| 19.6 | 1 | 1.14 | 4.67 |
So here is the formula for pitchers. The only difference is that I subtract ERA and WHIP from their respective replacement level values, instead of the other way around, because, obviously, the lower ERA and WHIP the better. I also divided it by 5 to make the value numbers similar to the batter values. There is no way to make overall rankings that includes both hitters and pitchers, but I divided the pitcher values by 5 to make it a little easier to read as well.
SP: Value = ((W – 8)*19.6 + (K – 116) + (4.30 – ERA)*114 + (1.35 – WHIP)*467)/5
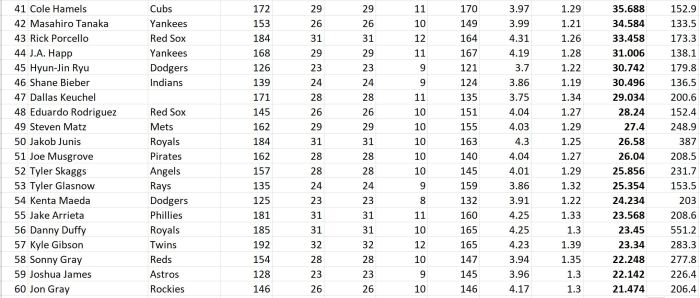
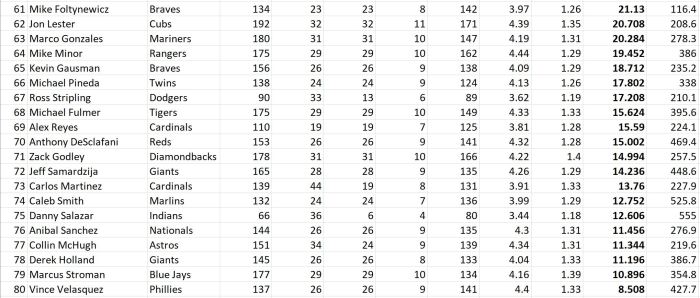
The Player Values (Starting Pitchers)
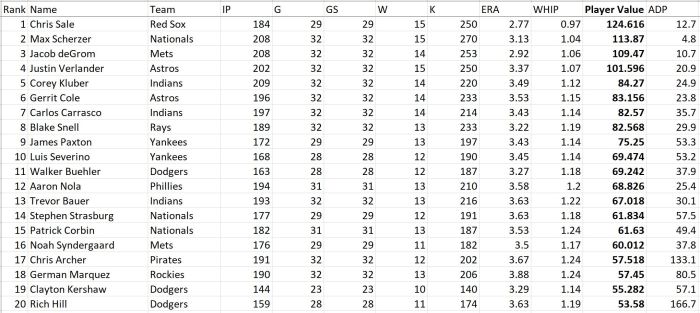


Some sleepers that this system projects include Chris Archer, who Steamer projected to have a respectable 3.67 ERA, Robbie Ray, who Steamer projects to have a bounce-back season, and top-prospect Chris Paddack, who has been a stud in the minors, and Steamer has him being really good right away in the majors.
For leagues that have quality starts as a category, use your favorite projection system, because steamer does not project them. My system actually works better in leagues that use quality starts instead of wins (all leagues should do this by the way) because wins are difficult to project.
So there it is, a system that takes everything out of account except for the projections. I know it’s not perfect, but this is, in my unbiased opinion, the best way to evaluate players in fantasy baseball. Just like WAR, it’s about how much advantage you are getting at a player’s position by drafting him. If you made it this far, thanks for reading, and feel free to contact me with any questions!
Follow us on Social!
Facebook: M-SABR
Twitter: @MichiganSABR
Instagram: @Michigan_Sabermetrics

Leave a comment