by Billy Stampfl
Introduction
Baseball is a business, and ball clubs, like Fortune 500 companies and Silicon Valley start-ups, must constantly look for ways to improve and evolve. Oftentimes this involves forward thinking: How can Bayes’ Theorem work to project a player’s On-Base Percentage for each of the next three seasons? How will raising ticket prices affect sales? Of course planning for the future is wise, but sometimes the most advantageous way to plot for the coming years is to analyze what was done well—or not so well—in the past.
Given the Chicago Cubs’ ongoing success built on a foundation of exciting, young, homegrown players, the concept of effective rebuilding has been a subject of much discussion in the baseball world. Analysts deem Cubs executives geniuses and front office heroes, and then they try to explain how exactly Chicago’s lovable losers transformed into one of MLB’s elite in just four years. I’ve heard a lot of talk about how the Cubs have found success through the draft—specifically by spending more to sign draft picks, sometimes ignoring budgetary constraints. I set out to investigate how teams are valuing the draft in terms of spending; specifically, I wanted to evaluate how front offices are choosing to approach their draft allowances. Are better teams doing something differently? How has the draft spending landscape changed since 2011?
In this article, I’ll focus on the five most recent seasons—2012 to 2016—to see how teams spent their money acquiring players, developing farm systems, and ultimately building Major League teams.
Process
First I created a database of all 30 MLB teams, listing the following: Spending on free agents for every year since 2012, spending on international free agents each of those years, spending on the Rule 4 (Amateur) Draft, and bonus slot plus/minus. The last variable, bonus slot plus/minus, is one I want to explain, as the other ones are fairly self-explanatory and the bonus slot concept will be the focus of this piece.
The current Collective Bargaining Agreement was passed into baseball law in November 2011, and will remain in place until this coming December. One of the most influential terms of the CBA is the Amateur Draft bonus slot stipulation. By this provision, teams are allotted a certain amount that they can spend on draft picks each year, based on previous season record. Within the first 10 rounds of the 2016 draft, for example, the Phillies were allowed to spend $9,015,000 on amateur signings, while the Cubs were designated only $2,245,100. Why such a large difference between pools for these two clubs? The slots are determined based on win-loss totals from the season before, and the Phillies didn’t win a ton of games. Additionally, the Cubs exceeded their bonus pool in every year from 2012 to 2015, an action for which MLB imposes regulated penalties, as described below.
| Amount Exceeded By | Penalty |
| 0-5% | 75% tax on the overage |
| 5-10% | 75% tax on the overage plus loss of a first-rounder in next year’s draft |
| 10-15% | 100% tax on the overage plus loss of a first- and second-rounder in next year’s draft |
| 15% or greater | 100% tax on the overage plus loss of a first-rounder in next two drafts |
Let’s look at an example. In 2014, the Chicago White Sox were allotted a total of $9,509,700 to spend on their draft picks in rounds one through ten. This was third-most in baseball. (The White Sox had the third-worst record in MLB the previous year.) In the 2014 Rule 4 Draft, they spent $9,984,600, or $474,900 over their allowance. To determine what amount the White Sox were penalized, we divide their overage ($474,900) by the money they were allotted ($9,509,700). After doing the quick math, we see that they exceeded the MLB spending guideline by 4.99%. By design this value was just under 5%; only $9,500 more would have harshened the consequences for overspending considerably. But since they stayed within the 0-5% threshold listed in the table above, they were only required to pay a 75% tax ($356,175) and they kept all their future draft picks. So teams can take advantage of the system in obvious ways, as the White Sox did by spending right up to the limit before they would have lost a 2015 first-rounder.
The behavior exemplified by the White Sox in 2014 is not uncommon. Since 2012, teams have gone over their allotments 70 times out of 150 opportunities, by an average of more than $258,000 (though no team has ever exceeded the 5% limit). The chart below shows how teams have exceeded dollar limits much more in recent drafts.
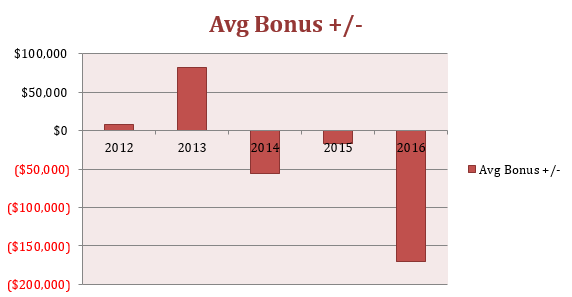
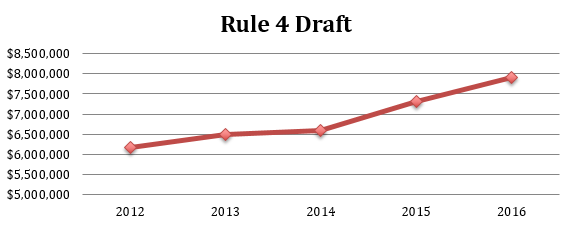
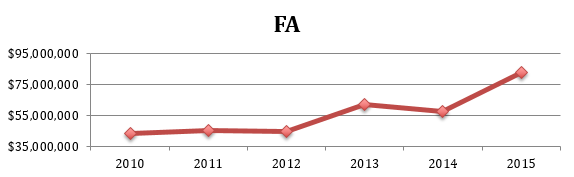
Notice the average overage in 2016; it was unprecedented. All but six teams went over their recommended allotments, a drastic increase from 2013 when only 10 teams dared to stray beyond MLB’s parameters. Indeed, average spending on the draft has risen in each of the past five years, per the line graph below. Subsequent graphs demonstrate how spending on free agents and international free agents, on the other hand, haven’t followed such a steady pattern. Free agent spending seems to be generally less predictable, while draft expenditures keep rising.

So why does amateur draft spending continue to rise every year?
Well, maybe the franchises that refused to overspend in the early years of the CBA have started to catch on. (Or at least they think they’re catching on.) The table below shows how much each team paid above or below its respective bonus slot in the 2012 Rule 4 Draft. Look closely at which organizations broke out the wallets, and which didn’t.
| ATL | $23,800 |
| AZ | $113,500 |
| BAL | $200 |
| BOS | -$282,200 |
| CHI | -$373,800 |
| CIN | $92,400 |
| CLE | $195,400 |
| COL | $221,600 |
| CWS | $0 |
| DET | $0 |
| HOU | -$157,500 |
| KC | -$148,500 |
| LAA | $46,900 |
| LAD | -$198,500 |
| MIA | $74,400 |
| MIL | $5,600 |
| MIN | $298,500 |
| NYM | $185,600 |
| NYY | $406,300 |
| OAK | $144,200 |
| PHI | $218,100 |
| PIT | $92,600 |
| SD | $90,100 |
| SEA | -$36,600 |
| SF | -$54,100 |
| STL | -$312,890 |
| TB | $49,200 |
| TEX | $83,800 |
| TOR | -$441,200 |
| WAS | -$112,300 |
I’m certainly not pushing it when I say that, in general, more successful franchises went over their limits in this specific draft. The Cardinals, who exceeded their bonus slot by a whopping $312,890, won the NL Central every year from 2013 to 2015 and narrowly missed a Wild Card berth this year. The Blue Jays, who struggled for most of the 2000s and early 2010s, have come to life in recent years. Then, of course, we have the Chicago Cubs. Under the direction of part-time miracle-worker, part-time curse-breaker Theo Epstein, the Cubs have spent a grand total of $1.7 million over amateur draft allowances since Epstein’s arrival, the most of any organization.
On the other end of the spectrum, we have the penny-pinchers, the teams that seem to loathe spending money on the draft. The Phillies might be our most prime example of undervaluing draft picks—in the first four seasons of the current CBA, Philadelphia undercut MLB’s bonus allotment by a total of $437,800. It’s no wonder they won a league-low 63 games in 2015. Though not all of the franchise’s failures since 2011 can be plainly attributed to excessive frugality when June rolls around, it isn’t hard to notice that the Phillies have struggled mightily as they have fielded teams of mostly old, ineffective players (see: Howard, Ryan).
But the eye test is not always enough. No matter how telling it may be that the powerhouse, younger-by-the-day Cubs have made it a habit of going over their draft bonus slot while the cellar-dwelling Cincinnati Reds have done quite the opposite, we need to look at some more numbers.
I decided to find the correlation between dollars spent in the 2012 Amateur Draft and Pythagorean wins in subsequent years. Pythagorean wins determines how many games a team should have won based on run differential. This statistic is widely believed to be more representative of how good a team really is, in comparison to normal wins and losses, as it attempts to tease out the luck factor. The table summarizes the regression analyses I ran, with the x-variable remaining dollars spent over-allotment during the 2012 Rule 4 Draft and the y-variable being Pythagorean wins in a respective year after that draft.
| X-Variable | Y-Variable | R-Squared |
| 2012 Bonus Pool +/- | 2013 Pythagorean Wins | 0.0199 |
| 2012 Bonus Pool +/- | 2014 Pythagorean Wins | 0.0747 |
| 2012 Bonus Pool +/- | 2015 Pythagorean Wins | 0.2174 |
| 2012 Bonus Pool +/- | 2016 Pythagorean Wins | 0.4857 |
Notice how the R-Squared values increase as years go by—this signifies that the players for which teams pay in a given draft start to have a real impact three or four years later. We would expect this, as players graduate out of the minor leagues and start to contribute to the big league team a few seasons after being drafted.
But the most noteworthy of the R-Squared values comes from the 2012 Bonus Pool-2016 Pythagorean Wins relationship, for which a scatterplot with least-squares line is shown below.

Teams that overspent are on the left side of the graph. The association isn’t overly tight, but there definitely seems to be some sort of pattern here. This would imply that there are positive effects of overspending on draft picks in order to build a stronger team a few years down the road. Sure, you will lose some money then, but with a few strong draft picks and savvy contract negotiations, a team could use those same picks to make up for the overage tax.
So we’ve reached a conclusion: Teams should be spending more on the draft. Or, rather, they realized that they should have been spending more and have since started to change. The Cubs made “rebuilding years” cool again; the Phillies are doing it now ($480,00 over budget in the 2016 draft), the Padres are doing it ($575,000 over slot), and the Tigers are giving it a try ($241,000 overage). And the logic is there: Spend more to sign young players in the amateur draft, sign fewer expensive (and older) free agents, and, in doing so, construct a young core of players that in just a few years will take pro baseball by storm. That all sounds great.
But is it the right conclusion?
It might be. That’s not a satisfying answer, I know, but the truth is that the sample size just isn’t all that large. The CBA has only been in place for five years, and there are just 30 teams in Major League Baseball. Also, many of the teams that favor overspending on the draft are some of the league’s richest; they tend to pay more for players of any age because they have the resources, and they usually win more games because of this.
Another reason to doubt that overspending on draft picks guarantees future success can be found when looking at bonus pool plus/minus numbers for the 2013 Amateur Draft.
| Team | 2013 |
| ATL | -$208,200 |
| AZ | $108,000 |
| BAL | $42,900 |
| BOS | $590,300 |
| CHI | -$511,900 |
| CIN | $65,900 |
| CLE | $132,100 |
| COL | $440,700 |
| CWS | $22,800 |
| DET | $316,800 |
| HOU | $877,300 |
| KC | -$78,700 |
| LAA | $372,000 |
| LAD | $590,300 |
| MIA | $127,700 |
| MIL | $64,300 |
| MIN | $26,400 |
| NYM | $82,600 |
| NYY | -$114,000 |
| OAK | $142,700 |
| PHI | -$73,500 |
| PIT | -$97,800 |
| SD | $7,900 |
| SEA | -$294,000 |
| SF | -$226,600 |
| STL | -$324,500 |
| TB | $136,800 |
| TEX | -$227,700 |
| TOR | $423,520 |
| WAS | $55,000 |
These data don’t pass the eye test, at least not as well as the 2012 data did. Sure, the Cubs remain on the overspending side, but the Houston Astros, for example, known for stockpiling young assets during a rebuilding period in the early 2010s, opted to save money in 2013. The Braves overspent considerably, and they’ve struggled in years since, while the Blue Jays spent well below their cap and have been to the ALCS in each of the last two seasons. Then again, it’s hard to even reach conclusions on this topic, as the 2013 draft was only three years ago and some of these players are still developing.
Thus, the principal idea we most likely have to consider is not how much teams are spending on the draft, but rather on whom they’re spending. This is why we can’t just look at increased Rule 4 Draft spending and say that front offices are suddenly making better decisions. It might be safe to say that their intentions have improved. But the most important factor will always come down to the players they overspend on.
The concrete conclusion we can gather from all of this is that teams are opting to overspend on the draft, more so than they did in the early years of the current Collective Bargaining Agreement. The reasons for this are unknown, though I’ve come up with a few theories:
- Rising revenues has led to more spending overall. Combined revenue of all 30 MLB teams has risen every year since 2007. This is shown on the line graph below. Armed with more money, teams tend to spend more, and that includes spending on the draft.

- More prep-level draft picks means higher signing bonuses and larger expenses for teams. Though Moneyball famously advocated taking college players in the draft, as Billy Beane viewed them as safer bets who are closer to the majors and thus more predictable, the early years of the current CBA saw a rise in the percentage of draft picks taken out of high school. There are a few reasons for this. High school players are younger, of course, and high school pitching prospects have less mileage on their arms. Prep players are also considered to have higher ceilings, and upside is everything to a lot of teams. But the preference for high schoolers comes with a price for Major League organizations: Prep players have more leverage in signing bonus negotiations. If a team balks at paying a high school draft pick what he’s requesting, that player can simply opt to go play in college if his salary demands are not met. A college senior boasts no such power. Thus, MLB teams are forced to pay more for their draft picks as high school players invade the market.
- Teams have started to take advantage of what seems to be a faulty penalization system. It’s no coincidence that organizations only overspend up to that 5% boundary—anything more would cost them valuable selections in subsequent drafts. So as more and more teams overpay (because they only have to pay a 75% overage tax), the overall numbers will demonstrate a trend in overbudgeting.
The second theory is worth investigating. Is the number of prep-level draft picks still on the rise? Do these picks average more lucrative bonuses?
I studied some data (provided by Baseball Cube) on the complete history of the MLB draft since 1965. These data included round and pick number, signing bonus, and whether the player was taken out of high school or college.
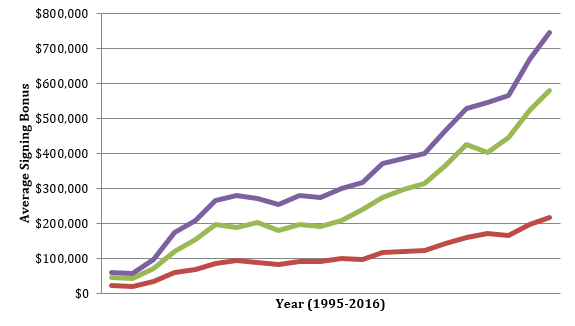
I first compared average signing bonus for both categories of draft choices. This confirmed what was suspected: High school players score more lucrative bonuses in comparison to their college counterparts. Since the first amateur player draft in 1965, high school players have averaged higher signing bonuses in 41 out of 52 drafts. And college players have made less in bonus money every single year since 1992.
Once again, this is due to prep players wielding more leverage in negotiations. A recently drafted high school graduate probably has a NCAA scholarship waiting for him. He can turn down a professional contract if the wage isn’t right. But a college player? He can’t be so selective. Consequently, high school players tend to make a great deal more in signing bonus money.
In addition, there is a noticeable trend in recent years when it comes to prep and college draft picks. However, it is not the one I expected to see and probably not one that would explain why team draft expenditures are rising. In each of the past three years, the percentage of college draft picks has risen, taking us back to the Moneyball days.
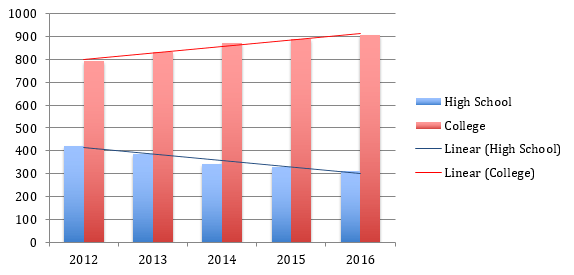
The divide between high school and college draft selections grows in each year from 2012 onward. This obviously does not support my theory that draft overspending is apparent due to franchises picking high school players—the more expensive options—more frequently. Teams are actually taking more college players in the era of the current CBA.
Theory 3 appears to be the most plausible, then. Teams are pushing the limits of the current Collective Bargaining Agreement’s bonus slot punishment format. There is simply not a large enough disincentive to prevent organizations from going up to that 5% border and then cutting themselves off before they start losing future picks.
Thus, the trend is there. Teams are disregarding MLB’s bonus slot recommendations in an increasingly common fashion. The questions now lie in the future: How will teams act in respect to draft bonus slots and how might the upcoming Collective Bargaining Agreement change to inflict harsher penalties for overbudgeting or even wipe out the slot concept as a whole?

Grreat reading your blog