
Image: (Thearon W. Henderson/Getty Images)
Each MLB season, there are players who exceed expectations and become productive players, or go from every day producers to all-star level. Others enter the season with plenty of promise, but fail to live up to the hype. Identifying which players are poised for a breakout is one of the most important endeavors in player evaluation, especially when traditional statistics paint an incomplete picture. wOBA and wRC+ can tell us how productive a hitter has been, but these do not fully capture a player’s offensive potential.
Expected stats give further insight into performance, and swing-level data gives an opportunity to look into the mechanics and decisions driving the results. Bat speed, contact quality, swing decisions, and other measurables can help to distinguish skills that support further improvement, while identifying players who may have production that is difficult to sustain.
With the offseason underway, this project looks to identify hitters who could outperform their past season by developing a swing-based metric, which I call Swing Profile+. The model aims to combine power and contact indicators into a single score, measuring a separate discipline metric to provide additional context. Using these tools, alongside a player’s actual offensive production, my goal is to identify players whose tools and swing profiles suggest more potential than their results currently show. This metric isn’t intended to be a perfect tool, as there is no exact way to predict breakouts, but instead gives a framework for narrowing the field and identifying players who are worth watching more closely. The question is straightforward: which hitters have the underlying tools to make a meaningful leap in 2027?
Data and Methodology
In this model, I examined a dataset of 205 hitters who reached the qualifying total in both swings and batted ball events in the 2026 season, ensuring the sample size was large enough for a number of metrics from Baseball Savant to avoid any small sample outliers. Overall, the ingredients of my model fell under three categories to cover the main skills players have at the plate: contact, power, and plate discipline.
At first, I aimed to completely project performance using swing characteristics, but with so many ways to succeed in the league nowadays I quickly moved off of this idea. For example, I originally thought to use ideal attack angle rate as a way to estimate power, as swinging with ideal loft would equate to ideal batted ball outcomes, but it only explained 8% of the variation in air rate using a linear model.
From there, I pivoted to include a mixture of swing metrics and other stats that could identify the process of a hitter, with the end goal of measures that could give a comprehensive idea of a player’s skills at the plate, not just repeated indicators of the same skill. I hoped to create a tool that could both stand as a skill and results measurement, valuing players who have the skills that don’t necessarily show up in a box score, but still can produce good batted ball data. Thus, ideally my stats would have at least some level of correlation with traditional measures of offensive potential such as xwOBA, with an understanding that it wouldn’t be a true one-to-one replication.
Additionally, I aimed to make plus stats, combining many components that might not be understood by typical fans into a metric that is easy to interpret. Having one data-backed number to evaluate hit and power tools, while also having it on an easily interpreted scale would allow for seamless interpretation: determining who is worth watching going into 2027.
My final metric combines the components of a player’s contact and power tools into a single Swing Profile+ score, while having my discipline metric as additional context to evaluate players, particularly to determine if a hitter’s approach supports their underlying tools. Keeping discipline separate allows the model to identify hitters with both strong contact and power characteristics without assuming that all hitters need to excel in all three areas. A hitter who would stand out to me once the model was created is a player who grades out as above average in terms of contact attributes and raw power, but who underperformed these tools at the Major League level.
Building the Model
Discipline:

Discipline was the easiest tool to track in my opinion, as it’s just the skills at swinging at good pitches, and laying off pitches outside of the zone. Because of this, it started with three inputs: chase rate, meatball swing rate (swing% at pitches in the heart of the zone) and zone swing rate to differentiate from passive players who take a lot of strikes. Upon further investigation, however, zone swing rate and meatball swing rate had a correlation coefficient of 0.79, meaning if both were included players would be rewarded twice for effectively the same skill, so zone swing rate was dropped from the final stat.
Both inputs were equally weighted, as not swinging at pitches outside of the zone is key, but it is also very important that players swing at pitches they can hit: those in the heart of the plate. With this in mind, the top ten hitters in terms of discipline are as follows:
| Player | Discipline+ | 2026 BB% (League average 8.4%) |
| Taylor Ward | 144 | 16.3% |
| Gleyber Torres | 132 | 13.6% |
| Kevin McGonigle | 128 | 13.4% |
| Trent Grisham | 127 | 12.6% |
| Chase DeLauter | 126 | 10.7% |
| J.P. Crawford | 125 | 13.1% |
| Tyler Stephenson | 125 | 10.5% |
| Juan Soto | 124 | 16.2% |
| Mookie Betts | 124 | 8.9% |
| Miguel Vargas | 122 | 14.3% |
Contact:

Contact was next, and there are a number of attributes that could be used to track good contact hitters. I wanted metrics that would primarily tie into a player’s swing rather than batted ball data, so I landed on three inputs: zone contact rate, perfect contact percent, and swing length. Zone contact is the most straightforward of the three, as good contact hitters don’t swing and miss at strikes.
Perfect contact is a newer Savant stat, tracking the percentage of swings upon contact that are lined up with the ball, centered on the barrel of the bat, and on time with the pitch, all of which combine for players who not only make contact but in a way that is more likely to produce success. Finally, to keep the model rooted in mechanics, swing length was included as shorter swings are correlated with less swing and miss, as swing length explains about 20% of the variation in whiff rates.
With that in mind, more emphasis was placed on zone contact and perfect percent, with the weights as follows: 50% zone contact percent, 40% perfect contact percent, 10% swing length. The top ten contact hitters in the sample according to Contact + are as follows:
| Player | Contact+ | 2026 Whiff% (League Average 25.5%) |
| Luis Arraez | 132 | 7.1% |
| Mookie Betts | 131 | 12.5% |
| Chandler Simpson | 131 | 10.8% |
| Steven Kwan | 125 | 8.2% |
| Nico Hoerner | 122 | 11.8% |
| Liam Hicks | 121 | 11.4% |
| Chase DeLauter | 120 | 15.0% |
| Ildemaro Vargas | 120 | 15.2% |
| Juan Soto | 118 | 20.9% |
| Javier Sanoja | 118 | 11.8% |
Power:

Power was the toughest tool to put a metric together for, as it is difficult to separate between power potential and the pop a player can actually utilize in game. Because of this, the inputs needed would cover the potential to hit ideal exit velocities, turning the potential into productive batted balls, and a batted ball profile that is ideal for extra base hits.
With this in mind, I landed on three inputs: bat speed as the purest measure of raw power, blasts per contact percent, and pulled air rate. Blasts are swings that are both fast (above 75 mph) and achieve above 80% of the maximum exit velocity given pitch speed and swing speed, with a combination of the two needing to total 164 or above to be a blast. According to mlb.com, batters slug 1.182 on these batted balls, with a wOBA of 0.727. Finally, pulled fly balls represent a very productive outcome for hitters, lowering the exit velocity and distance threshold needed to be a home run as parks are normally the shortest down the lines.
The most weight was put on raw power ability, with 50% being accounted for by bat speed, followed by 35% for blast rate per contact, and 15% pulled air rate. Based on Power +, the top ten power hitters in the sample are as follows:
| Player | Power + | 2026 Barrel % (League Average 7.6%) |
| Junior Caminero | 131 | 13.1% |
| Jac Caglianone | 127 | 13.0% |
| Yordan Alvarez | 126 | 16.0% |
| James Wood | 125 | 18.6% |
| Munetaka Murakami | 123 | 20.5% |
| Juan Soto | 121 | 14.0% |
| Fernando Tatis Jr. | 121 | 12.7% |
| Kyle Stowers | 121 | 12.8% |
| Pete Alonso | 121 | 15.3% |
| Oneil Cruz | 121 | 15.4% |
Putting it all together:

To combine contact and power into one metric, I weighted power at 60% and contact at 40%, as having more power will still allow for more production even with some more swing and miss. Finally, the combination of the two stats is centered at 100 and a set standard deviation of ten. This means that the sample mean is 100, and a Swing Profile+ of 110 means a swing that is one standard deviation above a “normal” player.
To explore the validity of this metric, I ran a multiple linear regression, estimating xwOBA using the combination of Swing Profile+ and Discipline+. The result was an R^2 of 0.436, meaning that about 44% of variation in xwOBA within the sample can be explained by my metrics, an encouraging initial relationship. More out-of-sample testing is necessary to further explore their predictive power.
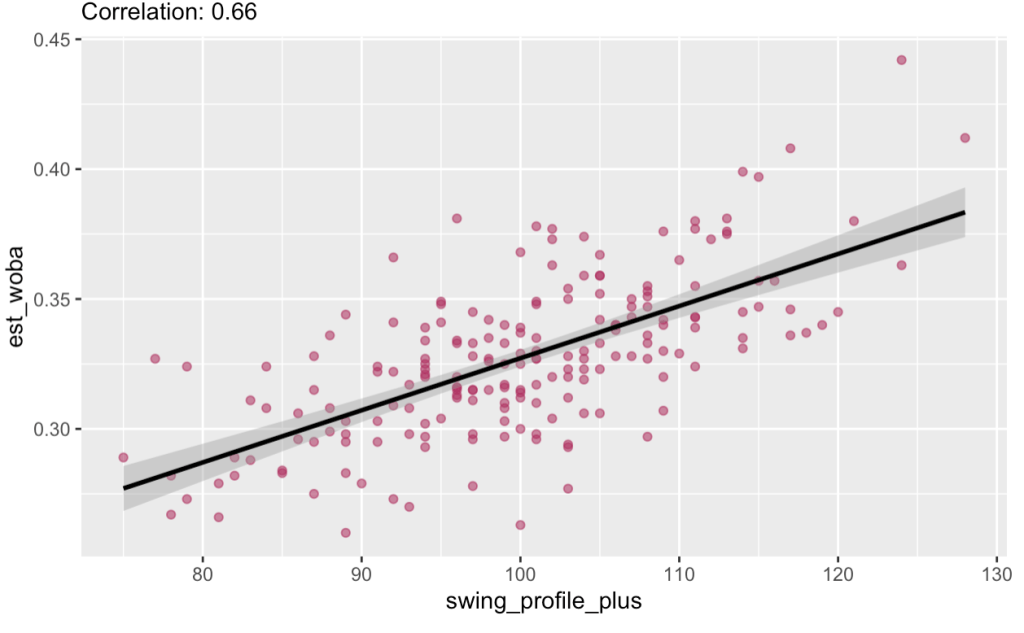
With that being said, this is who the model grades as having the best hitting tools among the sample, along with their discipline score and 2026 xwOBA:
| Player | Swing Profile+ | Discipline + | 2026 xwOBA (League Average 0.314) |
|---|---|---|---|
| Juan Soto | 128 | 122 | 0.411 |
| Junior Caminero | 124 | 98 | 0.364 |
| Yordan Alvarez | 124 | 98 | 0.442 |
| Fernando Tatis Jr. | 121 | 108 | 0.379 |
| Ketel Marte | 120 | 103 | 0.349 |
| Mookie Betts | 119 | 125 | 0.339 |
| Trent Grisham | 118 | 123 | 0.337 |
| James Wood | 117 | 125 | 0.403 |
| Chase DeLauter | 117 | 117 | 0.346 |
| Jac Caglianone | 116 | 92 | 0.357 |
Though there were some surprises at the top of the list, the overall link with expected production was encouraging to see. With the metric created, it was time to find players who underperformed their overall tools. Looking for players with well-rounded tools, these candidates needed to score 100 or higher in both Swing Profile+ and Discipline +, players who had an “unlucky” 2026 (lower wOBA than xwOBA), as well as players with a wOBA of 0.340 or below to filter out all-star level talents. This yielded 13 players as seen in the graph below:
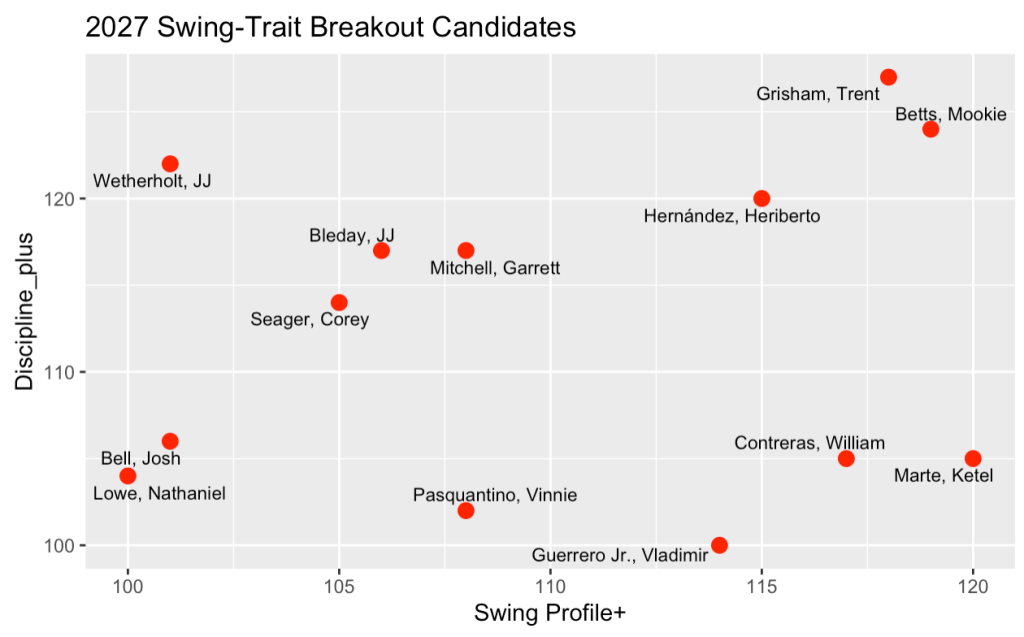
From the group of 13, I disqualified those who had recorded a season over a 130 wRC+ within the last five years, isolating more established names, as Betts, Marte, Contreras, Guerrero Jr, and Seager are all All-Star talents in the league today. Without further ado, here are my players to keep an eye on for the 2027 season, along with their Swing Profile+:
Veterans & Rebound Candidates: Nathaniel Lowe (100), Josh Bell (101), JJ Bleday (106)
Lowe and Bell will both hit the open market as first basemen on the wrong side of 30, with Lowe particularly having a very successful stint in Cincinnati before slowing down after a deadline deal to Cleveland. Bell offers above average plate discipline (106 Discipline +), and avoids strikeouts, with an above average barrel rate that didn’t lead to the best production. Lowe is more interesting as even at his age, he is in the 77th percentile for bat speed, and 93rd percentile for sweet spot rate, a recipe for success. The half season with Cleveland is concerning, but the under-the-hood look suggests he could be a good platoon add in the offseason, and could return closer to the production he enjoyed with the Rangers.
JJ Bleday looked like he was on his way to a breakout season, but a second-half collapse saw him finish with 1.3 fWAR and a wRC+ of just 103. Despite these numbers not popping off the page, Bleday offers a power profile beyond his performance in 2026 (109 power +). Bleday averaged 73.6 mph on his swing this season, an improvement of over one mile per hour from his previous career high. He compounded this mechanical change by improving his pulled fly ball rate to 30%, one of the highest in the league and allowing him to capitalize on the short right field at his home ballpark over the first half of the season.
My diagnosis for his second half collapse: a bit of luck in both directions. Bleday had 18% of his fly balls leave the yard in the first half, which dropped to just 9.4% in the second half despite his batted-ball data staying relatively constant across the halves. He also tinkered with his swing throughout the season, moving up in the box, closing his stance, and even losing bat speed as the months progressed. Yet Bleday swings hard, has a launch angle sweet-spot rate of 39.4% (94th percentile), and has a walk rate in the 93rd percentile, all recipes for success. This suggests that he is not the player his second-half made him appear to be, and his pull-fly ball propensity along with hitter-friendly home ballpark sets him up for potential success if brought back by the Reds.
Young Defensive Stars: Garrett Mitchell (108) & JJ Wetherholt (101)
Mitchell just snuck into this list with a wOBA of exactly .340, but there’s potential for growth even after his first healthy season yielded 3.1 fWAR. Mitchell plays an elite center field with 93rd percentile range, and the power potential is clearly there, grading near the top of the scale with a 117 Power +, and ranking in the top ten fastest average bat speeds in the league, but he only hit 11 home runs and slugged just above average at .416. Even with an already productive season, there is room for improvement for the center fielder, with a 96th percentile average exit velocity to go alongside a .353 xwOBA (88th percentile).
The disconnect is explained by two clear flaws in his game: swing and miss, and ground balls. In 2026, Mitchell had an average launch angle of 2.2 degrees, hampering his power potential but his elite exit velocities keep this from being a fatal flaw. The swing and miss will be what holds him back from being consistent at the plate, striking out over 30% of the time, and having one of the highest whiff rates in the league. Low chase rates and high walk rates demonstrate swing decisions aren’t the problem, but more consistent contact will allow him to be a better contributor at the plate. His high raw power with his propensity for whiffs and ground balls makes his profile very similar to rookie-year James Wood, and at 28 years old there is still time for Mitchell to tap into his incredible power potential.
Wetherholt is also a cheap addition to this list with 4.6 fWAR in his rookie year, though this was largely driven by the second-highest fielding run value in the league. Despite this, he finished just one percent above league average by wRC+. My model particularly likes his contact tool (110 contact +). This is further demonstrated by 87th percentile squared up rate, and he has more power than his .365 slug suggests. His xwOBA sat in the 82nd percentile, .029 points above his actual wOBA, the sixth highest difference in the league. Much of this comes from his home ballpark, as over the last three years by park factor Busch Stadium is the least friendly ballpark for left-handed home runs (73), and ranks 25th for southpaws overall. Demonstrating this difference, the second-baseman recorded a 123 wRC+ on the road, compared to just 77 in St. Louis. His advanced approach gives him a very safe floor, as he chased just 21.2% of the time (94th percentile), and had a walk rate over 10%. The power should continue to develop as he gains experience in MLB, whether the batted ball luck regresses upward to the mean, or he looks to gain bat speed at the expense of some of his contact potential. Wetherholt already excelled defensively, but the tools he possesses at the plate can make him a perennial all-star talent, if not one of the best players in baseball.
Under the Radar Contributors: Trent Grisham (118) & Heriberto Hernandez (115)
Trent Grisham achieved his true breakout season in 2025, hitting 34 home runs and a career-high 3.1 fWAR. After accepting the Yankees’ one-year qualifying offer, he saw his OPS drop by over 100 points, and spent two separate stints on the IL with hamstring strains. His struggles largely came over the second half of the season, with a 53 wRC+ after coming back from injury in July, and a 72 wRC+ in total over the second half. He saw his strikeout rate spike over this stretch, swinging nearly a mile per hour faster than in the first half of the season.
Despite these struggles, he finished with some promising batted-ball data, indicating an element of bad luck. The former first rounder ended the year with a 72nd percentile xwOBA of .337, .026 points higher than his actual wOBA, as well as 96th percentile squared-up rate, meaning he reaches near maximum exit velocity on a high number of his swings. Alongside a high pull air rate (21.6%), this allows Grisham to tap into more power than he would otherwise with below-average bat speed. The outfielder’s best tool is by far his plate discipline, with a 99th percentile chase rate, walking nearly 13% of the time, and even cutting down on strikeouts compared to 2025. An 18th percentile FRV shows the 29-year old will need to move off of center field, but an elite Swing Profile+ alongside promising batted ball data suggests possible improvement at his next stop after free agency.
The most traditional breakout candidate on this list, Heriberto Hernandez played his first full MLB season in 2026, becoming an everyday starter for a young Marlins team. He finished 2026 with a respectable 106 wRC+, and played a plus left field to finish with 1.7 fWAR. Power is the name of the game for Hernandez, grading out with a 118 Power +, and smacking 25 home runs. With an average bat speed of 74.3 mph, he finished in the 85th percentile or higher in a number of important batted ball categories: a hard hit rate of 48.6%, barrel rate of 12.7%, and expected slug of .475. Like many other sluggers, he does swing and miss a lot, especially on offspeeds (48.3%), but most of those whiffs come outside the zone, shown by a respectable 78% zone contact rate.
By having elite plate discipline (85th percentile chase rate), he makes pitchers attack him in the zone where he can do damage. With a Swing Profile+ of 115, he ranks 12th in the dataset, and will look to take the next step in 2027. Entering his age 27 season, the biggest improvement that Hernandez will need to see is against four-seamers, but his prior performance suggests improvement in that regard. Despite a negative six run value against fastballs this year, he was expected to slug .566 against the pitch, .145 points higher than his actual slugging. Hernandez isn’t a one-dimensional player, placing in the 80th percentile among left-fielders in outs above average, 87th percentile in arm strength, and even stealing 13 bases. The 27-year-old isn’t arbitration eligible until 2029, and with improved batted-ball luck, he has plenty of reasons for Miami to view him as a potential long-term contributor with 30+ home run power.
Potential Dark Horse: Dylan Crews (99)
Despite not qualifying for my final list of breakout candidates, Crews is a player worth watching in 2027. The second-overall pick in the 2023 draft has yet to live up to his prospect pedigree, finishing with an OPS under .700 in all three of his seasons. Since his MLB debut, however, the 24-year-old has sneakily added nearly two miles-per-hour to his bat speed, setting him up for improved power. He showed flashes of this improved skill in 2026, with 71st percentile average exit velocity and 62nd percentile barrel rate, but it didn’t show up entirely in his slash line. As the season went on, Crews toyed with his swing in an attempt to hit more fly balls, increasing his attack angle from seven degrees to ten by the end of the year. This saw his air rate improve from 56.7% to an above average 63.2%, an encouraging indicator.
The center fielder enjoyed more success over the second half of the season as a result, and yet still finished somewhat unluckily, recording a wOBA of .303 on his second half fly balls, over 100 points shy of his expected number. His below-average pull air rate of 13.8% also yields another opportunity to do more damage, as all but one of his home runs came from the pull side. What really holds him back from a breakout is his plate discipline, chasing 32.1% of the time and striking out nearly four times more than he walks. On pitches in the zone, he boasts roughly average contact rates, and a change in approach could allow him to capitalize more on the power potential he’s developed over the years. Whether he can pair his physical tools with a more disciplined approach will determine how much of that potential he realizes in 2027.
Limitations & Next Steps:
While Swing Profile+ offers a potential method to identify hitters whose underlying swing might be better than results suggest, at this point it is an exploratory tool and not a proven forecasting model. The metric has not been tested against future performance yet, so a high score doesn’t represent a guaranteed breakout. Additionally, this formula relied on my subjective decisions about which stats to include and how to weigh them; there could be different stats that more accurately represent a player’s tools. Finally, requiring xwOBA to exceed real wOBA to narrow my candidates intentionally favors hitters whose results lag behind their expected production. This means the final list reflects both my model’s skill measurements and my own assumptions about what qualifies a breakout candidate.
The next step is to test whether this metric can be used as a forecasting metric. Using previous seasons, I can calculate the metric and compare past scores with hitters’ performance the following season, examining their next season wOBA and wRC+. This would help determine whether players with higher swing scores continue to perform/improve more than comparable hitters, and whether it offers value beyond already established measures. My goal isn’t to replace existing metrics, but to instead identify skills and development opportunities that may be overlooked. Until I test it across seasons, its greatest value is to generate informed hypotheses about hitters worth watching in 2027, alongside identifying specific skills that are needed to turn underlying tools into better on-field performance.


Leave a Reply