(Keith Allison / Flickr)
This is the first installment of the State of Defensive Sabermetrics article series, where we break down some lesser-known statistics associated with the defensive side of the game. We hope to evaluate the robustness of these statistics, identify where they might fall short, and propose new metrics that will bridge these gaps. In this article, we provide an overview of some defensive sabermetrics currently in use.
Many agree that defensive sabermetrics lag far behind their offensive counterparts in plenty of ways. They seem to lack the ruggedness and seldom questioned repeatability of offensive stats, and for good reason. In the years that many have attempted to develop vigorous defensive metrics, it has proven to be an incredibly difficult task due to the very nature of defensive play. When building a metric, you need to account for so much variability due to the range of defensive positions, the sheer size of the field, and the different actions players take to make outs. In some cases, these actions are not quantifiable. For example, Tampa Bay Rays center fielder Kevin Kiermaier reads pitch signs from the catcher and shifts his position based on what the pitcher throws next. There is no easy way to capture these skills in a single metric. Despite some overwhelming shortcomings, we have come a long way since the years of using only fielding percentage to measure a player’s defensive worth. We highlight some noteworthy defensive sabermetrics below.
Defensive Runs Saved – DRS
Defensive runs saved is one of the widely known defensive sabermetrics, and it is a fairly simple statistic to read. It is read as the amount of runs that the defensive player has saved or let in based on his performance. Sample size is very important in all defensive sabermetrics, and it is a good idea to look at around two years of data to be sure of a player’s true skill. Below is how to interpret a player’s DRS and translate it into how much skill the player has.

While the interpretation of DRS is relatively simple, the calculation of this statistic is rather complicated. The basis of comparison of this metric comes from splitting the field in 260 directional vectors. For a batted ball, Baseball Info Solutions tracks the type of batted ball, the specific location of the ball, and how hard the ball was hit. It then tries and find balls hit with around these same metrics in the same vector. A player is credited on the play if he makes the play and at least one other MLB player that season missed that exact same ball in terms of hit speed, location of the ball, and type of batted ball. A player loses credit if he does not make the play and at least one other MLB player that season has made that play. The total is found by adding up all of the plays that are made and all the plays that are not made. Below are the top 20 players in DRS from 2015-2017.

Ultimate Zone Rating – UZR
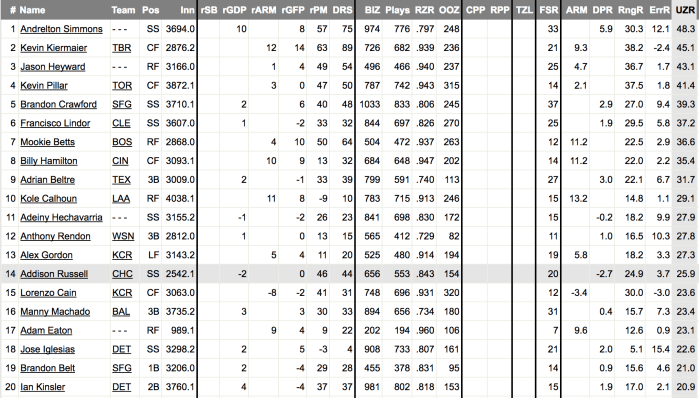
UZR is similar to DRS in that they both use the same scales, use zone ratings, and are scored on the same basis. The biggest difference between UZR and DRS is that DRS uses batted ball timer data, which measures how hard the ball was hit and how long a flyball was in the air. UZR uses four main metrics, which Fangraphs calculates: outfield arm runs, double play runs, range runs, and error runs. Below is the top 20 players in the MLB from 2015-2017 in UZR.
Catcher Framing
One of the new stats to finally get quantified is pitch framing. It has long been known that pitch framing has been around, and some catchers excel at it. Yet, no one has been able to quantify it, until a few years ago. Baseball Prospectus has one of the more reliable framing statistics. The way they do it is by putting a probability that each pitch is called a strike, based on all the previous pitches thrown in that location. If a catcher gets a called strike that is normally a strike 40% of the time, he is awarded +.60. Vice versa if the catcher does not get a called strike that is generally a called strike. While the tendencies of the umpire play a role in this statistic, this can be accounted for as the catcher typically encounters many different umpires over the course of the season. Below are the top 10 catchers in the league from this past year at framing. A rough estimate, as seen below, is that the best catchers are worth around 15-25 runs per year.

Statcast
Statcast is widely considered to be the future of defensive sabermetrics. They use doppler radar to track the movement of every player and the ball on every play. This allows us to be more accurate with the numbers of how hard the ball was hit and how far the fielder had to move.
Catch Probability
Introduced in 2017 by Statcast, catch probability allows us to evaluate defensive plays in the outfield. It judges every play based on the probability of the ball being caught, with a grading scale as follows:
0 – 25% catch probability = 5 star play
26 – 50% catch probability = 4 star play
51 – 75% catch probability = 3 star play
76 – 90% catch probability = 2 star play
91 – 95 % catch probability = 1 star play

As seen above, the ball is graded based on the distance from the player and the hang time of the ball. To calculate the catch probability, it looks at every ball that was hit with the same distance from the player and the same hang time. Catch probability considers the distance of the ball from a player instead of the distance traveled by the player because it does not want to wrongfully award the player for taking a bad path to the ball. In this way, the stat attempts to correct the misconception that every diving catch is a fantastic play. The same catch would look less impressive if the fielder took a better path to the ball and made the catch with less effort. The Kevin Kiermaier example of reading pitches is what throws this off a little bit, because he is typically in better position to catch the ball to begin with and has less of a chance of making a “great” play on the ball.
Here’s an example of a true 5-star play when Billy Hamilton makes a catch in which he had a 7% catch probability:
Here is where catch probability trumps the eye test. This ball had a catch probability of 75%, but due to Kemp’s bad route he had to dive and made it look like a very impressive play.
Outs Above Average
This statistic was created to as a way to analyze catch probability. It is a very simple statistic in terms of how it is calculated. If a ball has a catch probability of 40% and the fielder makes the play then he is credited with +0.60. If that same ball is not caught by the fielder, then he is deducted -0.40. All of these are added up over the course of the season to get the player’s season OAA. Below shows the top 20 players in OAA for the 2017 season.

The State of Defensive Sabermetrics
In short, while there are a handful of solid defensive sabermetrics, they each have their strengths and shortcomings. In the coming article series State of Defensive Sabermetrics, we at M-SABR are going to dive deeper into analyzing some of the defensive sabermetrics and potentially create our very own defensive sabermetric. Stay tuned!

Leave a comment