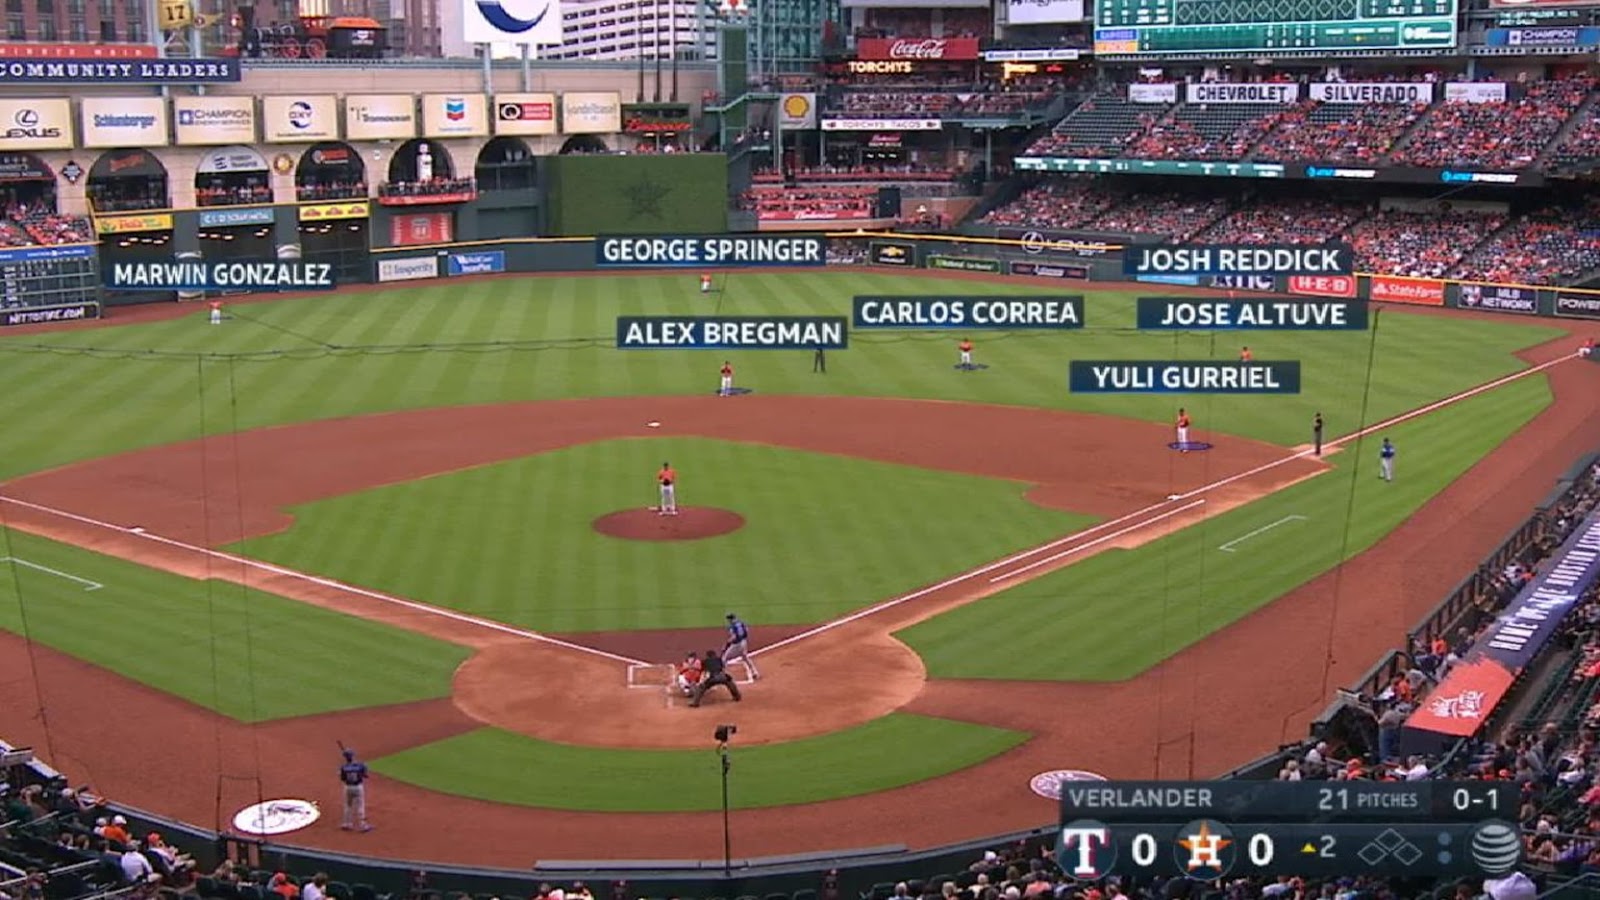
(Image Credit: MLB.com)
Imagine you’re managing Game 7 of the World Series. You have your ace on the mound, but you also need to know how to align your infield defense correctly. Should you shift your infielders, or play more of a traditional configuration? Overall, the prevalence and creativity of “the shift” in baseball has dramatically increased over the last couple years. In fact, the widespread growth and utilization of alternative player positions has caused several high profile stars, such as Francisco Lindor and Gerrit Cole, to publicly push back against the movement. For the moment, however, the shift is here to stay, and it’s become an important part of baseball strategy to managers around the league. An example of this stark increase in progressive thought regarding baseball’s defensive positioning can be seen below, as more statistics-based teams like the Astros have started employing extreme shifts in order to counter heavy hitters like Joey Gallo.
MLB managers are, for the most part, all qualified individuals with extensive experience in the game. However, no one is perfect, and sometimes the moment is just too overwhelming, as Kevin Cash’s blunder in going to the bullpen too early in this past year’s World Series demonstrates. While that particular oversight was not related to shifting, it still shows that a manager’s intuitions are constantly being put to the test for 6 months straight, and that sometimes they make wrong or ill-informed decisions.
Currently, managers only have their gut and partial data to rely on for answering this question. At its core, our mission was to engineer a software that, given a pitcher-batter matchup, would dictate the ideal defensive positioning for the infield. With our software, managers can begin to rely even more on statistical analysis and data to make the right decisions. Our advisory prediction is based on several factors that lend a specific utility to the software. This alleviates human discretion by giving the manager an unbiased parameter to decide to what extent he should shift, if it all. Relying on statistical-based analysis such as our software would therefore be helpful to any team’s managerial success.
We took as comprehensive of an approach to data collection as possible, focusing on the Statcast era of the 2015-2020 regular seasons and playoffs. Our model is based on four factors: pull percentage, batter mentality, the handedness of both pitcher and batter, and pitcher fastball velocity. We set a minimum of 200 balls put in play for each factor to ensure that our sample size is reliable for each individual player. If a specific player does not have sufficient data for one of the factors, a warning is produced and the factor will not be counted in the program. For instance, some players may not have 200 balls in play with the shift on, while others may not have 200 balls in play without the shift on. Due to these limitations, we decided not to include the mentality factor since the data does not have a big enough sample size.
At the beginning of our journey, we hypothesized that pull percentage would be the primary indicator in determining whether to shift. To measure pull percentage, we divided the field into three equal sections, meaning a completely balanced hitter would pull the ball 33% of the time. As a result, it might intuitively seem that the major league average would hit to each part of the field a third of the time, but most hitters favor their pull side as they are more likely to hit for power by pulling the ball. In addition, since the MLB has trended towards sacrificing strikeouts for more and more power, pull percentage has continued to increase dramatically in recent years. Within our sample, the average pull percentage is near 39%. Therefore, in order to determine whether we will shift a player, we must examine how far they are from both the 33% and 39% thresholds. For example, Joey Gallo pulls the ball almost 50% of the time. On the opposite end, DJ LeMahieu impressively pulls the ball only 21% of the time. The software would therefore suggest shifting Gallo and not to employ the shift on LeMahieu. In other words, a shift on Gallo will theoretically increase the chance of the defense recording an out, while it would decrease the chance on LeMahieu. While the indicator of pull percentage is extremely integral to deciding whether to shift, we knew the software needed more factors to rely on in cases where players had less of a polarized pull percentage factor. To improve the software, we examined more specific conditions.
The second element the software takes into account is pitcher and batter handedness. We examined pull percentage for right-handed and left-handed batters against both right-handed and left-handed pitchers. To start, batters tend to pull the ball more against pitchers of the opposite handedness. Right-handed hitters pull more against left-handed pitchers relative to right-handed pitchers, and vice versa for left-handed hitters. The residuals we obtained were fairly consistent, with both right- and left-handed batters pulling the ball about 1.5% more against pitchers of the opposite handedness. While it is true that this average is not a very large difference, there are many batters who significantly exceed the 1.5% mark in pull percentage, which should lead shift against them being more effective. For example, Yadier Molina pulls the ball 5.6% more against lefties and Freddie Freeman pulls the ball 4.7% more against righties. Various factors could be impacting this phenomenon, such as ball sight, varying strategies against pitchers based on their handedness, or the geometry of the angle of the pitch. While some of these factors may be relevant, they are not easily quantifiable. Thankfully, geometry can give some explanation. When a moving object strikes a surface at an angle, it will bounce off of that surface at the same angle in the opposite direction (ignoring the spin of the ball). From the perspective of the batter, a ball thrown by a righty comes at you from the left side, which means it is more likely to go to the right. In comparison, a ball thrown from a lefty comes at the batter from the right side, and is more likely to go to the left.
Due to these more probabilistic outcomes, a righty should pull the ball towards left field against left-handed pitchers, and a lefty should pull the ball towards right field against right-handed pitchers. However, there are exceptions to the rule. Anthony Rizzo, who hits from the left side, pulls the ball 3.6% more against lefties, and the right-handed Nolan Arenado pulls the ball 4.7% more against righties. Because of this, the general rule of where the ball is more likely to go is much less relevant than the actual percentage difference against certain handed pitchers. This explanation, based on throwing angle, explains why the outcomes are more likely to happen. It is also true that, if one player pulls the ball significantly more against one type of pitcher, the defense should be more likely to shift against him.
The third factor the software utilized is pitcher fastball velocity. The purpose of this inclusion was the wide variety of skill by many batters to handle and adjust for speed. Some batters might not have the bat speed to pull a 97+ mile per hour fastball while others might wait back on slow pitches and take them the other way. Because there are different capabilities and approaches, we felt it was necessary to take this into account. We chose to look solely at fastballs, as the underlying reason for variation among fastballs is due to speed. For off-speed pitches, the movement of the ball is a much bigger factor (which is difficult to quantify). We grouped fastball velocity into three groups: below 90.7, between 90.7 and 95.6, and above 95.6. These cutoffs represented one standard deviation above and below the mean fastball velocity in 2019 and 2020. Within these groups, we found each player’s pull percentage, and took that statistic into account when predicting how he’d perform against an opposing pitcher. This factor’s goal is to incorporate the pitchers’ arsenal and how the batter will perform against it. Along with the pull percentage among hitters, we collected data on the pull percentages that certain pitchers face. As a general rule, slower pitchers tend to have the ball pulled against them more often, while faster pitchers tend to see the ball go to the opposite field more frequently. Hard-throwing pitchers like Dustin May and Jacob DeGrom both have pull rates of around 34% against them, while slower-throwing pitchers like Adam Wainwright and Jon Lester have the ball pulled on them closer to 40% of the time. While there are certainly numerous exceptions to the rule, this trend can likely be explained by the fact that, assuming the swing timing for any hitter is the same, a fast pitch will be struck by the bat further back on home plate relative to where a slow pitch would be hit. This causes fast pitches to be hit earlier in a batter’s swing, causing less pull in faster fastballs. Of course, some batters have the skills necessary to control their swing timing against different pitches, which is why it is important to consider the batter’s individual pull percentages against each range of speed. If a batter tends to wait on slow pitches, he shouldn’t be shifted on as frequently, while if he over-adjusts for fast pitchers, it would likely make a defensive shift more effective.
The final ingredient was to determine batters’ mentality and effectiveness of the shift. Often, when a player faces a shift, they approach the at-bat differently than if there were no shift. Some batters hit the opposite way, away from the shift, to attempt to increase their likelihood of getting a hit, yet other batters decide they should embrace the shift and hit over it. Additionally, there are older players who have been slow to adjust to the modern era shift. To detect their approach, we first viewed pull percentage with and without the shift. It is meaningful to note that we removed home runs from this sample. This is because a defense cannot defend against a home run. Therefore, the defensive placement is inconsequential for a home run. For instance, Matt Carpenter pulls the ball 47% of the time against the shift and only 41% of the time against a regular defense, meaning shifting will increase the chance Carpenter will hit the ball at a defender. On the other hand, Kolten Wong pulls the ball only 32% of the time against the shift and 42% of the time against a regular defense, so shifting Wong will be ineffective because of his ability to beat the shift by hitting away from it.
In addition to the pull percentage, we also considered whether the batter is doing more damage when the shift is on or off. While the pull percentage is important, examining overall performance is also necessary. If a player hits an opposite field single against the shift, the pull percentage would dictate to not shift, but we would certainly prefer a single with the shift on instead of the batter getting an extra-base hit that a shift could potentially have taken away from him. Using specific cases, George Springer has a 0.309 wOBA against regular defensive positioning and a 0.255 wOBA against the shift. Conversely, Dee Strange-Gordon has a 0.304 wOBA against regular defense and a 0.358 wOBA against the shift. For this factor, the model would suggest a shift against Springer and no shift against Strange-Gordon, because the goal is to minimize the batter’s productiveness. Hopefully, taking these last two checks into account will strengthen the model by using empirical evidence against regular defense and the shift.
While analyzing the mentality factor, it is important to note that different teams utilize the shift with strikingly different percentages. Because teams have different qualities of pitching and defense, the various shift percentages could mean that the average wOBA and pull percentages could be different against the varying defensive deployments that different teams use against them. Against the Diamondbacks, Nolan Arenado has a 0.322 wOBA when facing the shift. In comparison, he has only a 0.289 wOBA when the Dodgers put the shift on him. Within this time, the Dodgers have shifted the most and supported the lowest ERA. The Diamondbacks, however, fall in the middle for both shift percentage and ERA against. Through the example of Nolan Arenado, we can see that a team’s pitching and fielding talent dictates a significant amount of wOBA. Despite this, we are unsure whether the act of shifting or the team’s better defensive production caused a lower wOBA for Arenado when facing the shift. Therefore, we will assume that this decrease in wOBA is caused by the shift and that the difference in opposing teams’ defensive production evens out over the span of 162 games. In the future version of the software, a more quantitative approach will be taken to improve this phenomenon.
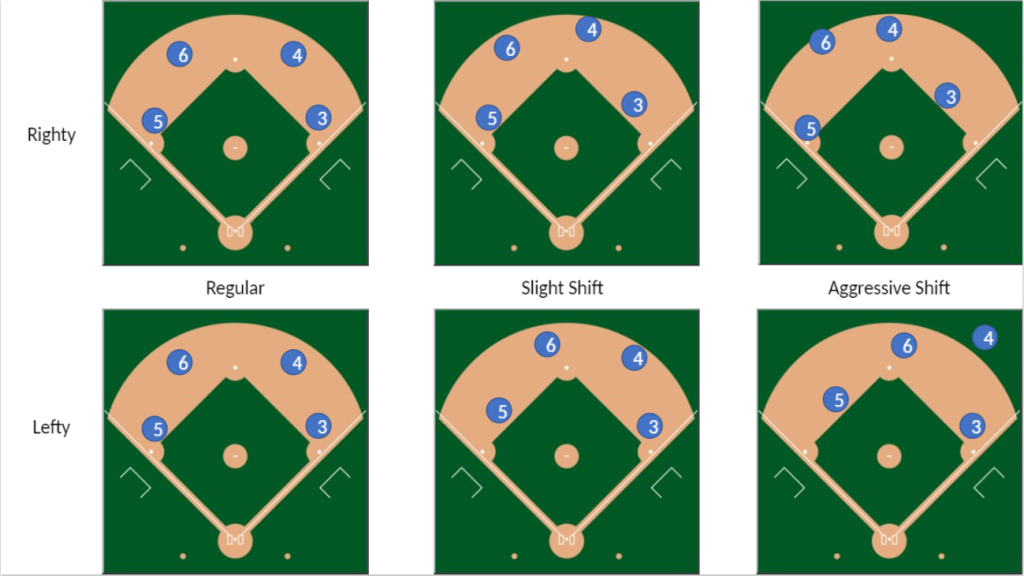
Putting it all together, the model will use the four aforementioned factors to suggest a defensive placement given a pitcher-batter matchup. There are three possible outcomes: regular defense, slight shift, and aggressive shift. The diagrams below demonstrate what we recommend for the three defensive placement for both lefties and righties. It should be recognized that runners on base, batter, count, and outs should be contemplated when shifting as well. If there are runners on base, defenders should recognize steal potentials and double plays. Depending on the batters’ speed, count, and outs, placement should also consider the possibility of a bunt. Although all of these elements should be taken into account, the baseline for the batter-pitcher matchups are produced by the software. In the software’s next publication, we would take into account the base/out state and the count to produce a more specific shift for each scenario.
Now that you understand the model, put it to use! Let’s say you are sitting in the crowd at Citi Field, and Bryce Harper is up to bat in the top of the seventh against Dellin Betances with one out and bases empty…how would you shift him? Just look up Bryce Harper and Dellin Betances, and you will find out!
Here is the link: https://msabrshiftingalg.shinyapps.io/Implementation/
A special thank you goes out to Mark Rulkowski, a University of Michigan professor in the Statistics Department, for all of the help on the project and always being there when we needed him. We also want to thank Gaby Sanchez, former MLB first baseman and current ESPN Analyst, for helping us come up with this incredible idea!
Team:
Ernesto Herrero: Group Leader
Matthew Sussman: Research Director, Microsoft Excel Specialist
Owen Stern: Programming Director, Rstudio Specialist
Joseph Dooley: Data Acquisition/Analysis Specialist
Samuel King: Researcher and Data Analyst, Writer

Leave a comment