by AJ Janetzke, Cam Cain, Felipe Zwanzger, Gregory Severin, Matt Schneider, Max Smith, Yuki Mori, and Zane Harding
Welcome back to the M-Sabermetric All-Stars series! For those of you who remember the first two 2017 volumes of this series about Batting Average on Balls in Play and Barrels, the concept of our statistically driven superteam should be familiar. For new readers, let us explain:
While it no longer arbitrarily decides home-field advantage for the World Series, we all love the MLB All-Star game. From breakout sensations and one-hit wonders to future Hall of Famers, everybody gets their time to shine at the Midsummer Classic. Yet when Midwinter and the heart of the offseason comes around, M-SABR takes its turn to put our own sabermetric spin on the All-Star team.
Instead of focusing on overall performance though, we hone in on one singular advanced statistic, assembling a roster of the batters who led their respective position groups within it. Over this series of articles, our primary goal is further our readers’ understanding of various Sabermetric stats by assembling these prestigious hypothetical All-Star teams and analyzing in depth why the given honorees excelled in the statistical category at hand.
For example, in our 2017 BABIP version, we saw that while BABIP for pitchers is typically chalked up to randomness, our All-Star team featured a few archetypes such as the high exit velocity power hitter that made enough outs via strikeout to not hurt his BABIP like Miguel Sano, or the heavy line-drive hitter like Jose Altuve.
Finally we will use the team’s collective fWAR over 162 games to estimate how our roster might fare over the course of a season when paired with a league average pitching staff.
That being said, let’s dive into our exploration of O-Swing%, one of Fangraphs’ Plate Discipline statistics, which is calculated by dividing a player’s number of swings at pitches outside of the strike zone zone by the total number of pitches seen outside of the strike zone.
Now, having good plate discipline is a challenge for any hitter. The distance from the mound to the plate is 60.5 feet, but the pitcher releases the ball usually around 5 feet in front of the mound, plus the batter must hit the ball around 2.5 feet in front of the plate to make solid contact with the ball. This shorter reaction distance for the batter is about 53 feet. A fastball coming in at 90 mph will go from the pitcher’s hand to the area where the batter should make contact in 0.4 seconds. On average, a batter takes 0.15 seconds to swing the bat, which means he has 0.25 seconds to locate the ball, determine the spin, decide if he will swing or not, and then actually swing. The point here is that this all happens extremely quickly, and it’s a difficult job choosing to swing at a pitch or not. As with any job, some are better at it than others.
On our team is the player at each position who swung at the lowest proportion of pitches outside of the strike zone, demonstrating excellent plate discipline and hopefully revealing both underlying causes and consequences of a low O-Swing%. Can we expect our low O-Swing% superstars to perform well in other plate discipline indicators? Let’s find out:
C – Russell Martin, Blue Jays, 14.4 O-Swing%, .194/.338/.325, 1.1 fWAR/162
Russell Martin led all Major League players with the lowest O-Swing percentage in 2018 (minimum 300 plate appearances), yet he was below league average at the plate overall, posting a 91 wRC+. Seeing that there is a moderate inverse correlation between O-Swing percentage and wRC+, you would think that Martin’s wRC+ would be higher. That said, look at that slugging percentage! Yes: Russell Martin’s slugging percentage was lower than his on-base percentage last year. Meanwhile, he posted a pedestrian .305 wOBA.
While it’s true that Martin only posted a .325 slugging percentage (and a batting average below the Mendoza line), there are positive takeaways from his performance this season. For one, his on-base percentage wasn’t bad, sitting at .338. That’s because he had a 15.9% walk percentage, the eighth-best walk percentage in all of baseball (minimum 300 plate appearances), another indicator of his strong plate discipline. Martin walked at a higher rate than Aaron Judge, Jose Ramirez, Alex Bregman, and Mookie Betts in 2018. He just didn’t hit like they did. Honestly, he didn’t come close to hitting like they did. Thus, it makes sense that Martin posted an uninspiring — yet not terrible — 91 wRC+ and accumulated 0.6 fWAR due to only playing in 90 games. That’s not bad for a 35-year-old catcher. (Also, congratulations to Russell on posting the highest walk percentage of his career this season, even though he has walked at a 10.5% rate or better every year since 2007!)
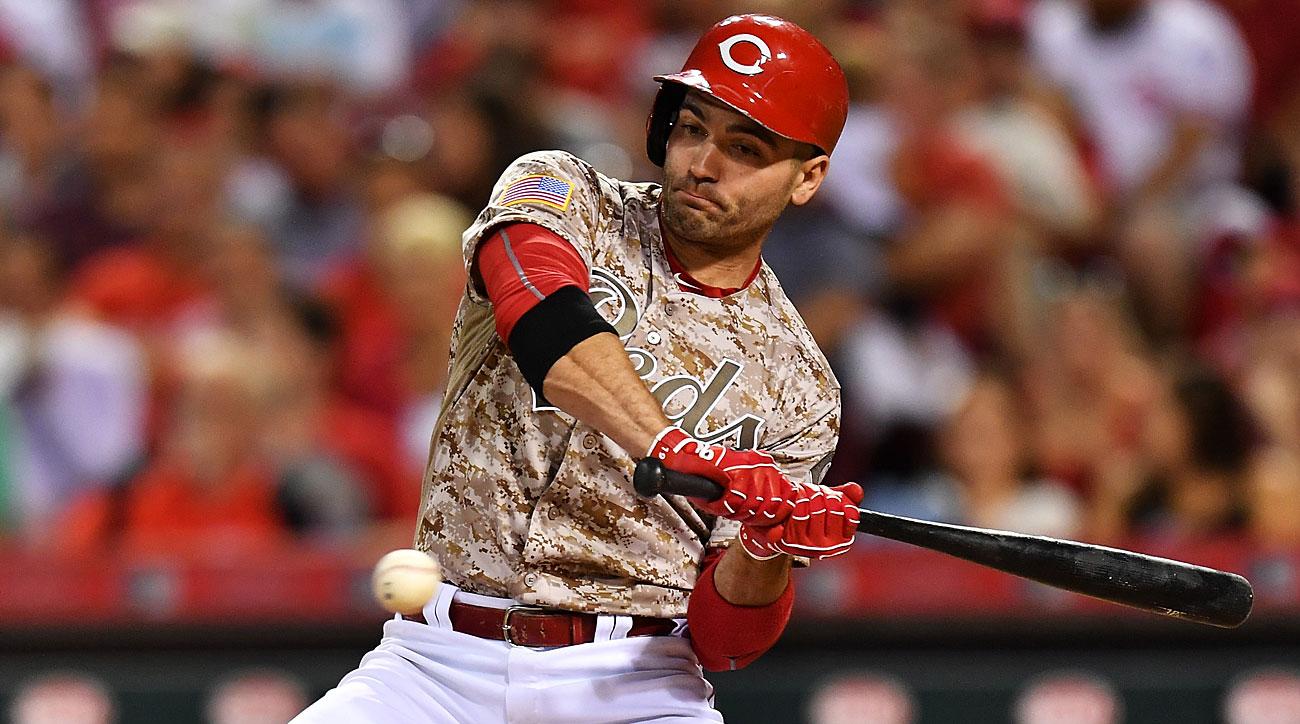
1B – Joey Votto, Reds, 16.4 O-Swing%, .284/.417/.419, 3.9 fWAR/162
If there’s one thing we all know about Joey Votto, it’s that his eye is outstanding. This decade, Votto’s .436 OBP and 970 walks are both tops in the majors by a longshot. His 17.5% walk rate during that stretch is nearly four standard deviations above the mean. That’s why it’s no wonder that Votto’s 16.4% O-Swing% is by far the lowest among qualified batters this year, making it the third year in four that he has led in this statistic. Votto’s success at the plate comes from the fact that he almost never swings at pitches outside the zone. Joey Votto’s once-in-a-generation discipline has allowed him to become one of the best hitters in all of baseball. His 159 wRC+ since 2010 shows that his approach has worked, as it is second only to Mike Trout. His power decreased this season, but he was still able to manage a 131 wRC+ and an NL-leading .417 OBP. And though his 12 home runs were the lowest in any full season of his career, his relatively unchanged batted ball metrics, as well as his uncharacteristically low HR/FB rate, tell me that this season was an aberration on that front. Joey Votto is truly a special player, and that’s all thanks to his plate discipline.
2B – Logan Forsythe, Dodgers/Twins, 16.4 O-Swing%, .232/.313/.291, -0.3 fWAR/162
Let’s start off with the good news: Logan Forsythe is exactly Joey Votto’s equal. Here’s the bad news, though: the above statement only applies to O-Swing%, where the two of them tied for second among all batters who stepped up to the plate at least 300 times in 2018. Here’s the really bad news: the comparisons to Joey Votto end here. The ability to lay off pitches outside of the zone was really the only good part of a season that saw Forsythe put up a wRC+ of 70, tying him for 15th worst among all of baseball (minimum 300 PA).
Of course, the best players don’t just not swing at pitches outside the zone, they supplement that with either the ability to hit for power, or to get on base via the walk. Forsythe demonstrated neither of these abilities. His walk rate of 9.9% tied him with Giancarlo Stanton and Cameron Maybin, neither of whom are particularly known for plate discipline. Coupled with his .232 batting average, this results in a .313 OBP. Not great. Even worse, though, was Forsythe’s measly .291 slugging percentage, bested only by Delino DeShields’ .281 for the lowest SLG in the league. Basically, we’re looking at a player who can’t hit for power or average, nor can he take a walk. But he doesn’t swing at too many pitches that aren’t strikes, so he’s got a spot on our team anyway.
SS – Jorge Polanco,Twins, 25.2 O-Swing%, .288/.345/.427, 2.7 fWAR/162
Compared to others on this list, you might be surprised with Jorge Polanco’s O-Swing % being the lowest for all shortstops in 2018. I don’t blame you, but shortstops in general just couldn’t hold back on swinging at outside pitches all season.
Coming back from a strong 2017 season, Polanco began the year on the 80-day restricted list for PEDs and came back to put up solid numbers, posting the .288/.345/.427 line with 6 HRs. The O-Swing % might have been somewhat influenced by his small amount of plate appearances compared to others (Daniel Robertson had as many plate appearances and is on the leaderboard as well). Looking at the lists of plate discipline for shortstops with minimum 300 PAs last season, Polanco was also in the top 5 for Z-Swing % (62.8%) and SwStr % (6.1%). He had also ranked in the top 5 for BABIP (.345), which means that he had showed plate discipline and although swung at inside and outside pitches, was able to connect for a hit. He was also eighth in O-Contact % (71.4%), which also shows of how he was able to connect his outside-of-the-strike-zone batted balls to a hit.
While it is true that Polanco had fewer games played (77) and plate appearances (333) because of the restriction—which to an extent helped with his stats—he was still a threat at the plate, having career highs in BA, BABIP, OBP, SLG, wOBA, and wRC+. He especially showed that in 2017 when the Twins made a playoff push, posting career-highs in everything, starting by lowering his K% and raising his BB%. It may have dipped last season (18.6 K% compared to 14.3 K% in 2017), but playing a full season in 2019 and becoming more consistent should help him reach the flashes of potential we saw during the 2017 season. And the Twins would be needing for some players like him to step up in the 2019 season if they want to compete with the Indians for the AL Central after a forgettable 2018.
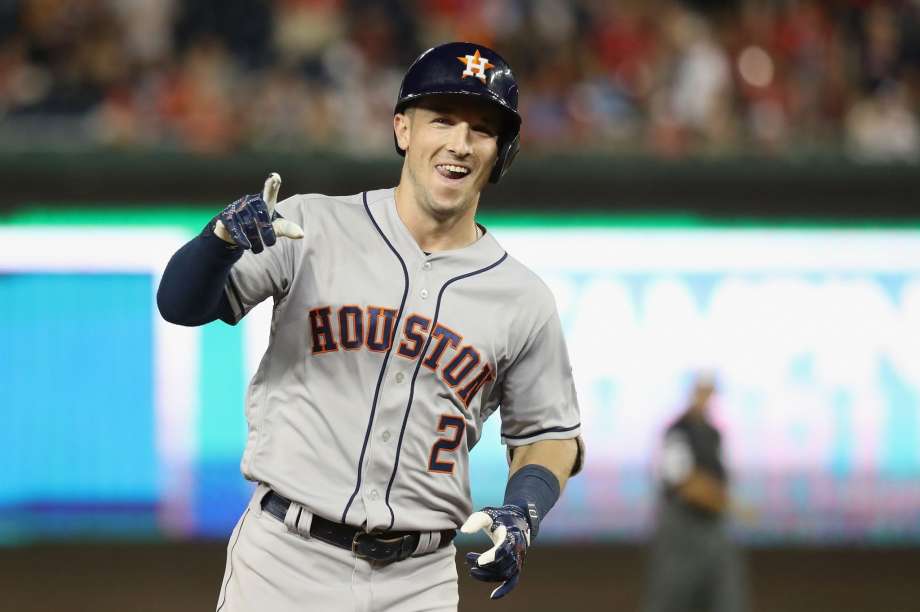
3B – Alex Bregman, Astros, 20.0 O-Swing%, .286/.394/.532, 7.8 fWAR/162
With all due respect to the king of plate discipline Joey Votto, third base is where this team finds its star: Alex Bregman. Not only was his 7.6 fWAR tied for fourth best amongst all batters in baseball thanks to career bests in HR, R, RBI, AVG, OBP, SLG, wRC+ and just about any stat imaginable, but his plate discipline numbers ascended from good to elite.
First let’s look his swing rates. By virtue of him being on this team, you can already deduce that he led all third basemen with the lowest O-Swing%, meaning he excelled at laying off of bad pitches. More interestingly, though, Bregman laid off most pitches, swinging at only 37.1% of all pitches he saw in 2018. This number ranks fifth lowest amongst all qualified hitters.
However, those are not his only top 5 rankings across his position or league wide, so let’s take his contact and overall numbers into account. These numbers demonstrate the success of his selective approach: when Bregman swung, he hit the ball, and he hit it consistently. His 88.5% Contact rate was fourth best in baseball, and it did not matter whether the swings came on strikes or potential balls, as his Z- and O-Contact rates were both top 5 at his position. And as if those numbers weren’t enough, his excellent 13.6 BB% (fifth at 3B), exceptional 12.6 K%, and MLB second-best 4.3 Swinging Strike% further solidify the impressive approach Bregman exhibited at the plate in 2018.
He might not have Votto’s track record yet, but Bregman appears to be a master of plate discipline and our team is certainly happy to have him lock down the hot corner.
LF – Robbie Grossman,Twins, 18.6 O-Swing%, .273/.367/.384, 0.9 fWAR/162
We go from one of the most recognizable names on our roster to one of the least. I present to you Robbie Grossman, the Twins’ light-hitting, zero-base-stealing, admittedly unspectacular outfielder. But while 5 HR in 129 games might not catch anybody’s eye, posting the only O-Swing% below 20% amongst all left fielders makes Grossman stand out and earns him the only All-Star spot he is likely to ever attain.
Yet it is specifically that ability to lay off of bad pitches that allowed Grossman to turn in an above average 108 wRC+ in 2018, because when he did see good pitches, he put them in play—something that is quite beneficial for a batter with an impressively high .329 BABIP. Though he put the ball in play, and posted strong plate discipline numbers across the board such as his 85.4 Contact% and impressively low 5.7 Swinging Strike%, Grossman’s actual batted ball profile prevented him from reaching any level beyond slightly above average. His 1.5 Barrels/PA rate only placed him 312th amongst qualified hitters, and his 86.8 average exit velocity was nothing to write home about. Fortunately, we don’t really care about the limitations Grossman’s game brings with it here. Instead, we appreciate the batting eye he displays and the contributions it allows him to make. Welcome to the team!
CF – Brandon Nimmo, Mets, 19.7 O-Swing%, .263/.404/.483, 5.2 fWAR/162
Overshadowed by Jeff McNeil’s otherworldly second-half, it was actually Brandon Nimmo who was the Mets’ most productive offensive piece in 2018. His O-Swing% of 19.7% was the 6th lowest in the majors for players with at least 300 plate appearances, which serves as a testament to his exceptional vision at the plate. As a result of this, Nimmo posted an OBP over .400 despite having an average in the low .260’s. His exit velocities last season were slightly above league average (89.2 MPH compared to an 87.4 MPH league average), so while he isn’t crushing the ball, he’s finding gaps and making his hits count. While his exceptional ability to get on base must not be taken for granted, it must be taken with a grain of salt.
Nimmo struck out in 26.2% of his plate appearances last season, which shows that despite his elite vision at the plate, there is some serious swing and miss to his game as well. Taking this into account, Nimmo figures to see more pitches in the strike zone this coming season as pitchers try to exploit the weaknesses associated with his swing. His ability to walk, evidenced by a 15.0% walk rate last year, holds constant with his career numbers, but perhaps that says more about his vision at the plate than his true ability to fight off difficult pitches. Taking all of this into account, I still think Nimmo has the ability to get on base at a clip in the mid-.300’s, but at the expense of a lower batting average than his .262 mark last season.
RF – Andrew McCutchen, Giants/Yankees, 19.4 O-Swing%, .255/.368/.424, 2.7 fWAR/162
Last but not least for our position players, we get to right field, where the familiar name of Andrew McCutchen and his 19.4 O-Swing% await.
The league average for pitches per plate appearance is 3.9 in the 2018 season. Andrew McCutchen, on the other hand, saw an average of 4.24 pitches per plate appearance. This would make sense if he swung at fewer pitches outside the zone. He is tied for 9th in the league for the most pitches seen per plate appearance, which can show that he is more likely to see pitches go by. But does this mean he just doesn’t swing at all? We would have to look at Z-Swing %.
Essentially the opposite of O-Swing%, Z-Swing% is the percentage of pitches you swing at that are in the strike zone. A low Z-Swing% would mean you take a lot of pitches, which would lead to seeing more pitches per plate appearance. McCutchen does have the 16th lowest Z-Swing% at 64.1.
One could say that McCutchen only has a low O-Swing% because, as seen in his Z-Swing% and pitches per plate appearance, he doesn’t swing that much. Is it bad to not swing? In 2018, Carlos Gomez posted the highest Z-Swing% and 2nd highest O-Swing%, meaning that he swung at practically every pitch unless it’s a wild pitch. He also played below replacement level, producing a fWAR of -0.5. Adam Jones had the highest O-Swing% and only manufactured a fWAR of 0.5. Meanwhile, McCutchen had the 2nd lowest O-Swing% and put together a 2.6 fWAR. He did only hit .255 on the year, but his OBP of .368 was higher than both Gomez (.289) and Jones (.313). Maybe not swinging at every hittable pitch is a good thing. Patience and plate discipline are excellent qualities to have as a hitter in the MLB, and they certainly helped make McCutchen a former NL MVP, 5-time All-Star, and 4-time Silver Slugger.
DH – Joe Mauer,Twins, 21.1 O-Swing%, .282/.351/.379, 1.3 fWAR/162
Typically, the designated hitter is a beefy power hitter whose job is to get up to the plate and swing for the fences. In 2018, five of the top ten home run hitters in the American League were DHs. The status quo for DHs is they hit the ball hard and well. Joe Mauer, however, does not follow this mantra. Compared to his peers at the position, Mauer is a more patient and calculated hitter. Mauer made this list because he swung at only 21% of pitches outside the strike zone. Most of the other DHs were above 32%. Mauer’s keen eye is not a product of his years of experience, though; he has always been exceptional at taking pitches for balls. For his career, he swung at just under 22% pitches outside of the zone.
With such a low O-Swing% and great pitch recognition, one would expect Mauer to have had a great year in 2018, but this was not the case. The aging Mauer posted a 98 wRC+ in 2018, the second lowest in his career. To go along with this, Mauer walked less, struck out more, and hit for less power compared to his career averages. To go along with a low O-swing%, Mauer had league’s lowest Z-swing% in 2018 and second lowest overall Swing%. Mauer was extremely patient at the plate in 2018, but because of his age, he did not have much to show for it.
Mauer’s career might not have ended on a high note, but he still had a special career and will go down as one of the best hitting catchers of all time. Let his O-Swing% All-Star appearance serve as one final accolade.
Putting the Team on the Field
With our roster assembled and extrapolated fWAR/162 games calculated, we can approximate the team’s hypothetical season performance. To do so, we will pair our offense with a league average pitching staff and use Fangraph’s suggested formula of adding a baseline of 48 wins to a team’s fWAR total in order to project its full season record.
As for the average pitching staff, Fangraphs’ team leaderboards indicate that the mean Team Pitching WAR for 2018 was about 14.3 fWAR. Adding that to the 25.3 fWAR our lineup would have produced leaves us with 39.6 fWAR, or approximately 88 projected wins for this team.
Projecting a team featuring a heart of the order of Bregman, Votto and Nimmo, surrounded by various talented other starters for a borderline Wild Card record with a solid pitching staff sounds about right, and reinforces the relatively weak correlation between O-Swing% and overall offensive performance. Yet what we did see by diving deeper into our roster was that the ability to lay off of pitches outside of the strike zone generally spoke for enhanced plate discipline across the board, including a couple of off the charts outliers in Votto and Bregman. It might not win you a World Series, but our low O-Swing% All-Star team sure would wear the heck out of opposing pitchers.
Follow us on Social Media!
Facebook: M-SABR
Twitter: @MichiganSABR
Instagram: @Michigan_Sabermetrics
Categories: Articles, M-SABR All Stars

Hi this is somewhat of off topic but I was wondering if blogs use WYSIWYG editors or if
you have to manually code with HTML. I’m starting a blog soon but have no coding know-how so I wanted to get guidance from someone with experience.
Any help would be greatly appreciated!
I think it would be a team that could go deep in the playoffs. You see a lot of swing and miss from the hitters because of the great pitchers, but often unheralded guys become the heroes, and you could see a lot of them on a team like this that puts the bat on the ball.